

motorman7
 Subscriber
-
Posts
2,198 -
Joined
-
Last visited
-
Days Won
56
Content Type
Profiles
Knowledge Base
Zcar Wiki
Forums
Gallery
Events
Downloads
Store
Blogs
Collections
Classifieds
Everything posted by motorman7
-
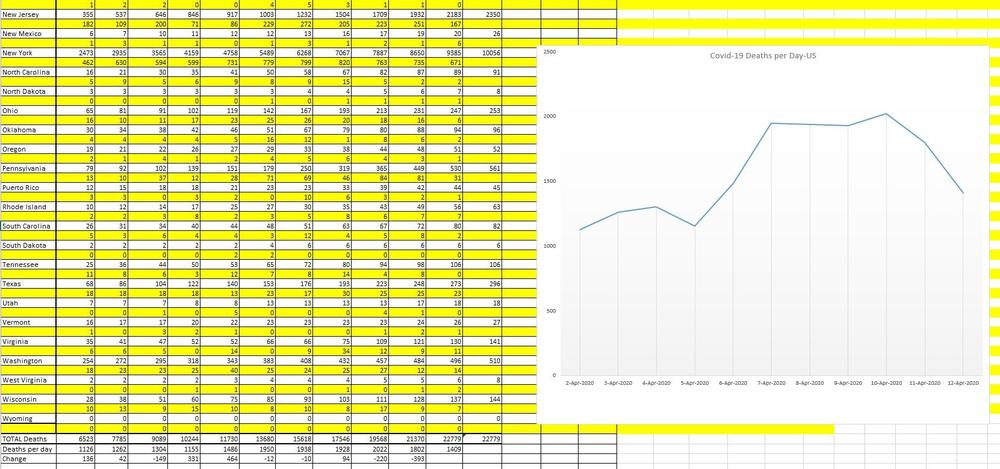
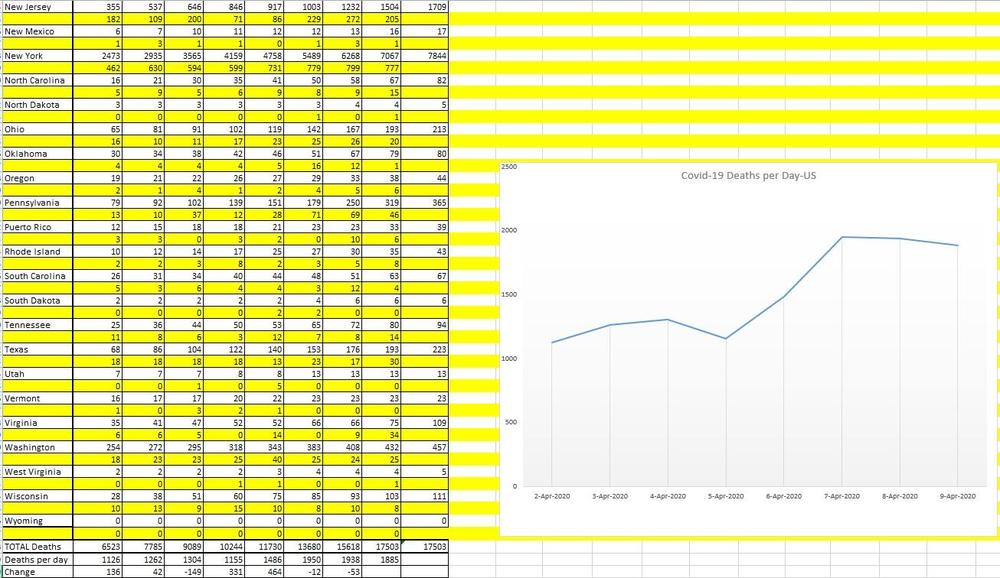
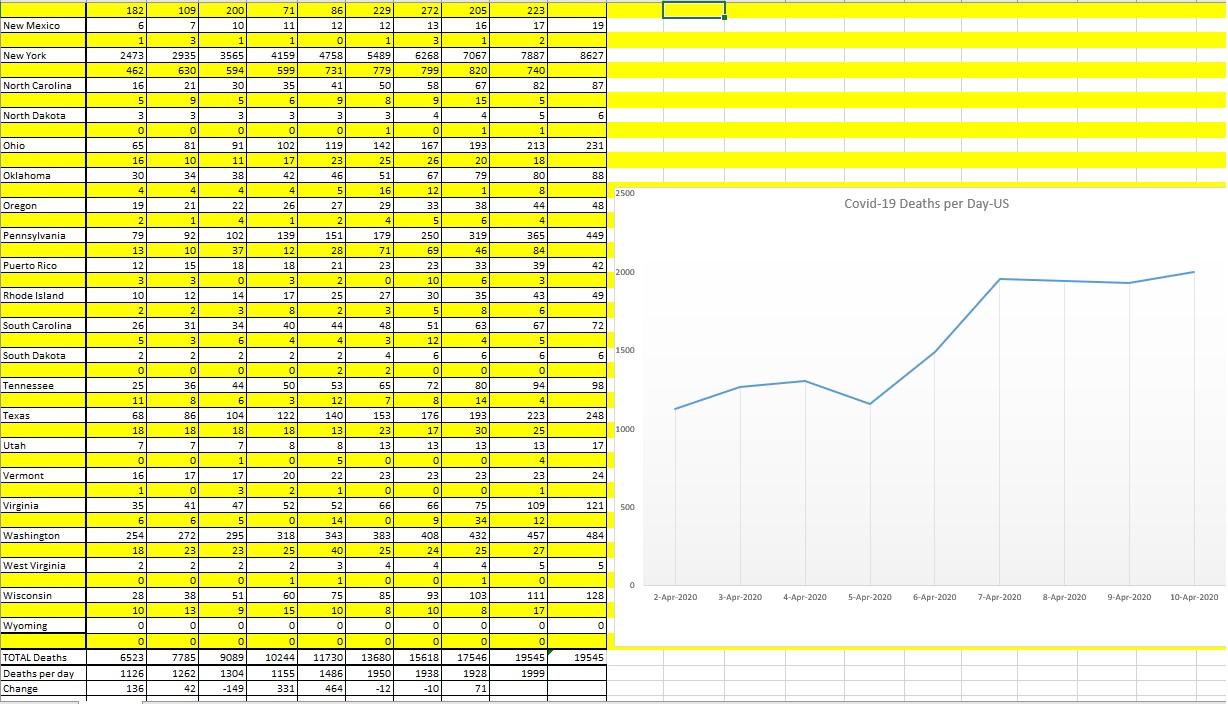
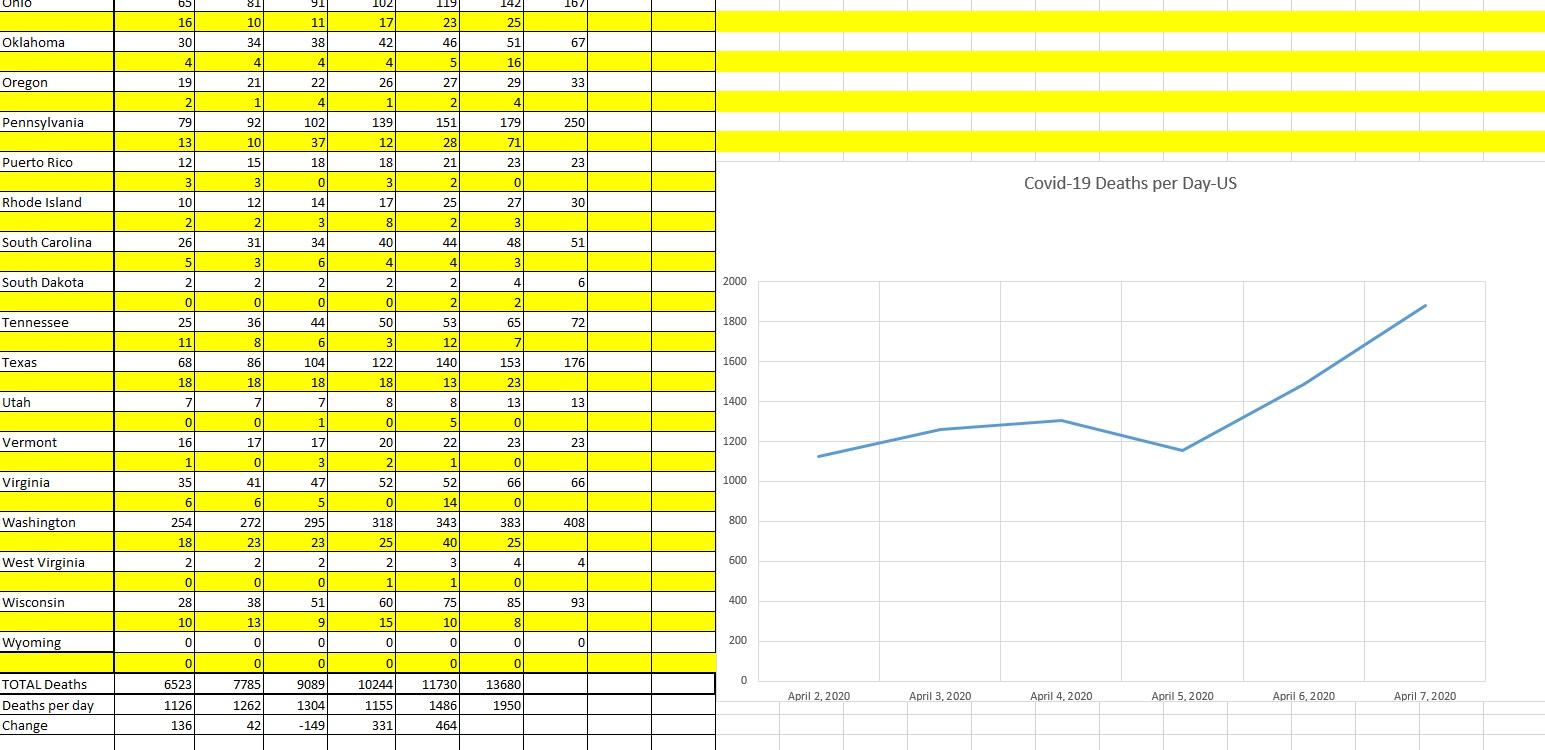
Significant drops the total US daily deaths for April 12 with a total of 1409. I doubt we will continue to drop as quickly and expect things to flatten a bit from here. New York, New Jersey and Pennsylvania showed significant drops. Most other states were slightly down. California still worries me. I liken this whole things to pulling off a band-aid. New York and New Jersey ripped it off pretty quick and my bet is they will be the first area to start getting back to normal. California and Texas are pulling the band-aid off very slowly. Less pain, but it will go on for longer. Illinois is the middle of the road. Wyoming still has zero deaths from Covid, great for them.
-
Seriously! Can you tell me the number of people that died of heart disease each day over the last week? Numbers are technically pretty close. Given the variation, you could be very wrong with that statement. Would you have been able to make that statement one week ago? (FYI, answer is NO if you check my charts) Will you be able to make that statement in a week or two? Honestly, I am not trying to belittle or make small the Covid issue. Let's just keep it in perspective. Fully support social distancing, limiting gathering sizes, face masks, etc. But let's look at the big picture.
-
Professionals also show respect to one another even when opinions disagree. Honestly, no need to site anything. The blue items were shown by the pulic.flourish people. I was not contesting that all. You did not seem to take issue with that in your earlier post. the Covid data is all on the chart in the post, and the source has been previously referenced. The math and averaging is pretty basic. Hopefully, no need to teach there. Just saying.
-
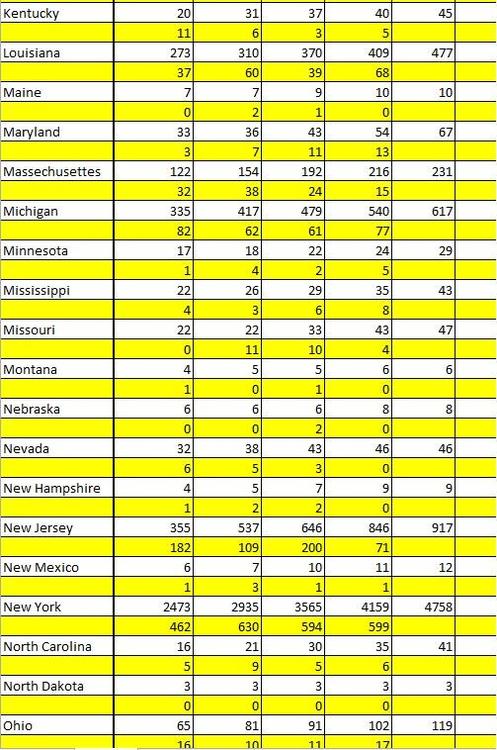
This animated chart GROSSLY misrepresents the fatality of the COVID virus. More high schoolers at work here . There really should be someone that does quality checks on this stuff instead of allowing idiots to misrepresent information. Let's do a little simple math. The average of the deaths shown in blue is the average daily deaths over the course of a year in the US. At 1774 deaths per day, Heart Disease is by far the most common killer at rough 647,000 people per year in the US. This is true and is shown correctly as are the other diseases shown in blue. The data for the COVID deaths, to be on the same playingfield as the other data shown, should be divided by the days that have past starting on Jan 1, 2020 since we don't have any previous annual data. The daily average is the number of total COVID deaths divided by the number of days that have past. That would be 21,370 divided by 102 days (in 2020) equals 209 deaths per day average. So right now it should be shown just below Diabetes on the chart. Lets assume 60K covid deaths for the year, Average is 164 deaths per day for the year, just below Diabetes. Let's assume 100K covid deaths for the year, average is 273 deaths for the year, just above Diabetes Yes, the current daily deaths are much higher than that, but honestly, we are probably at a peak. 1842 is not the average. At 1842 deaths per day, the total for the year would be 672,000 for the year....currently 5 times more than the total WORLD deaths. OMG ____________________________________________ That being said, here is today's chart update. Significant drop from yesterday m0stly due to New York and Michigan's lower numbers. Most other states were pretty flat.
-
Interesting, this was really fun work back then. I worked for a division of Lockheed Martin, ILS. I think it is now part of ULA with Boeing. I worked on Intelsat and was project manager for the Sirius Satellite launches on the Proton. Fun stuff. This was back in the 90's, early 2000.
-
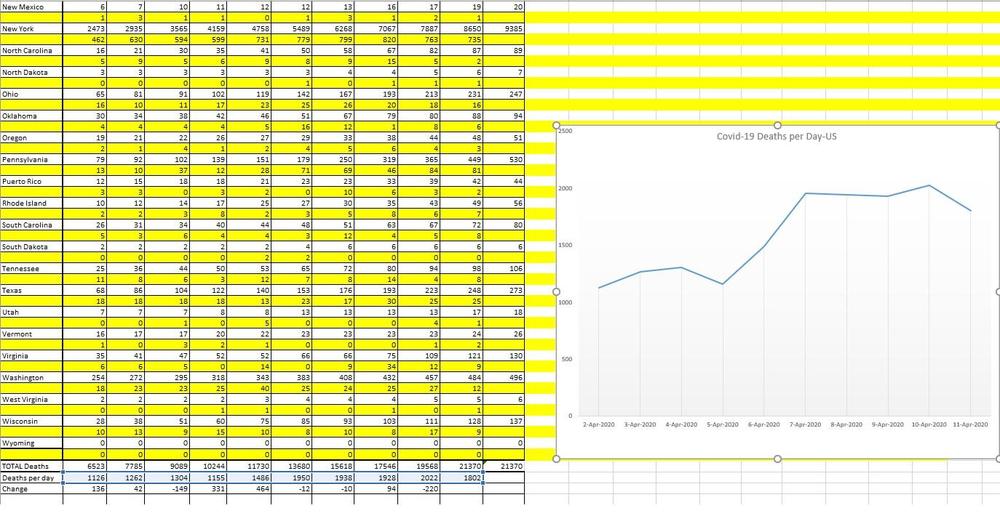
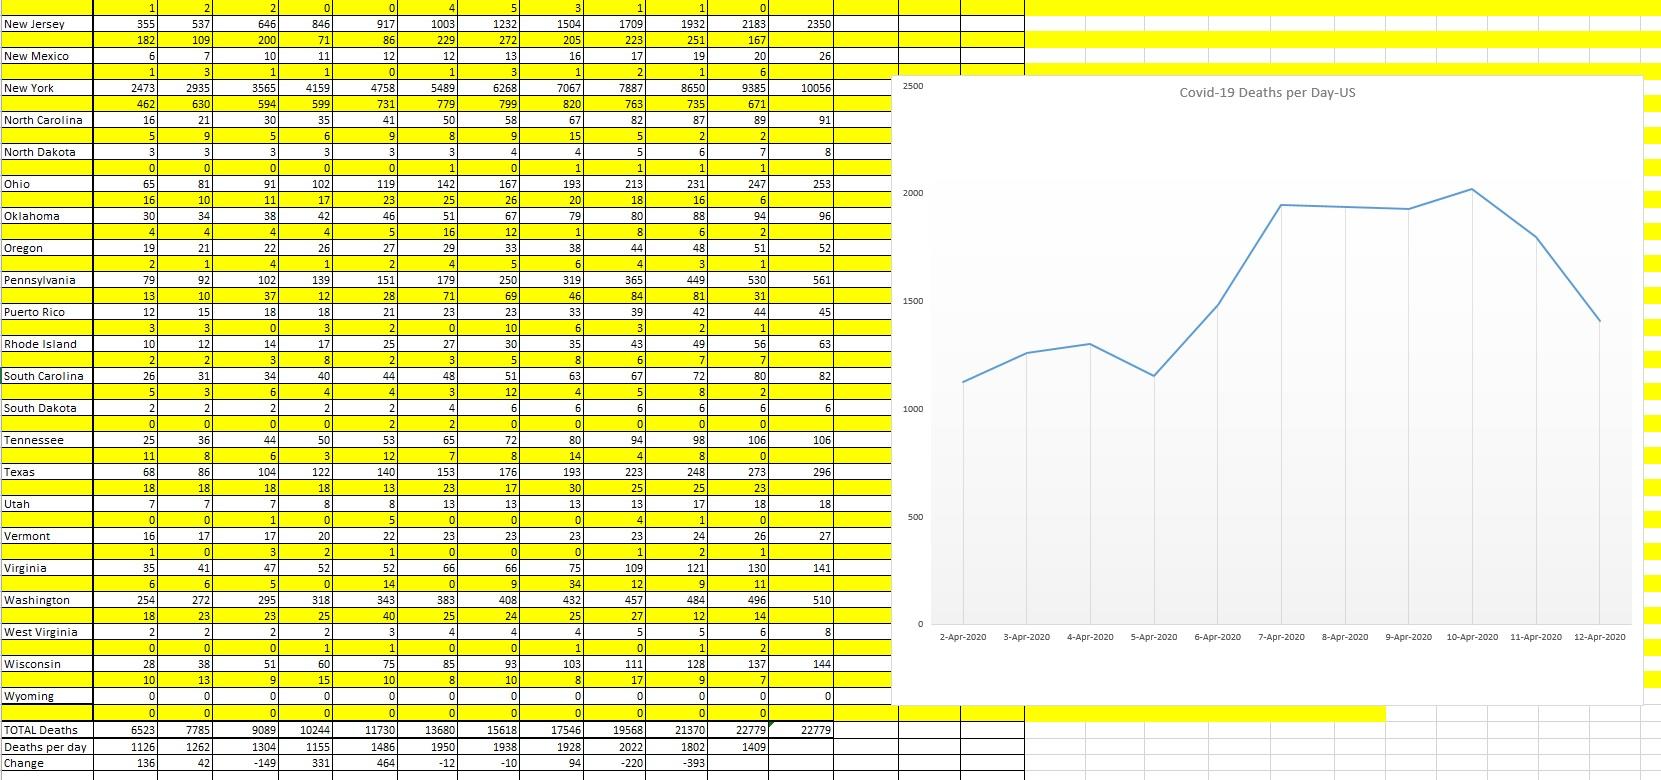
Here is the Daily US Covid deaths chart with the updates from yesterday. Slight drop off in New York and New Jersey with a large increase from Michigan. This has been the worst day so far with deaths at 1999. We are still hovering in a fairly tight range here and somewhat flat. New York and New jersey are now under 50% of the total deaths but not by much. Totally agree. I am surprised something significant has not popped up in California, Texas or Illinois, the large population centers. I wonder if it is the transportation system and the more spread out landscape. Sure would be nice to have more info on this. Did they have a relapse and get similar symptoms? No symptoms? Did they die? I hate reporting like this and feel that it is fear mongering. If they told you that all 91 were just fine then it would be no big deal. Instead, they state a fact and provide no significant info and leave you to fear the worst. Here in California I think we are almost overprepared. The local hospital just gave layoff notices to 221 employees. Canceled most elective surgeries and waiting with 250 empty beds for Covid patients. Guess that's why Gavin loaned out respirators to other states. https://www.nbcsandiego.com/news/local/palomar-health-issues-temporary-layoff-notices-to-221-employees/2303014/ Interesting thing about the Chinese: I used to work for a company that managed the integration of US satellites onto US and Russian rockets. I worked the Russian side of the business. China also has/had launched US satellites on the Long March. When we would visit the Satellite manufacturers, if the Chinese were there, the US satellite manufacturers would cover up their satellites with sheets or tarps so they were not visible. When it was just the Russians, everything was left uncovered and people would be working on the satellites. The Satellite manufacturers took a lot of precaution when the Chinese were in the building. The Russians just wanted to make sure the meetings were done by 5PM so they could get to Happy Hour when it started.
-
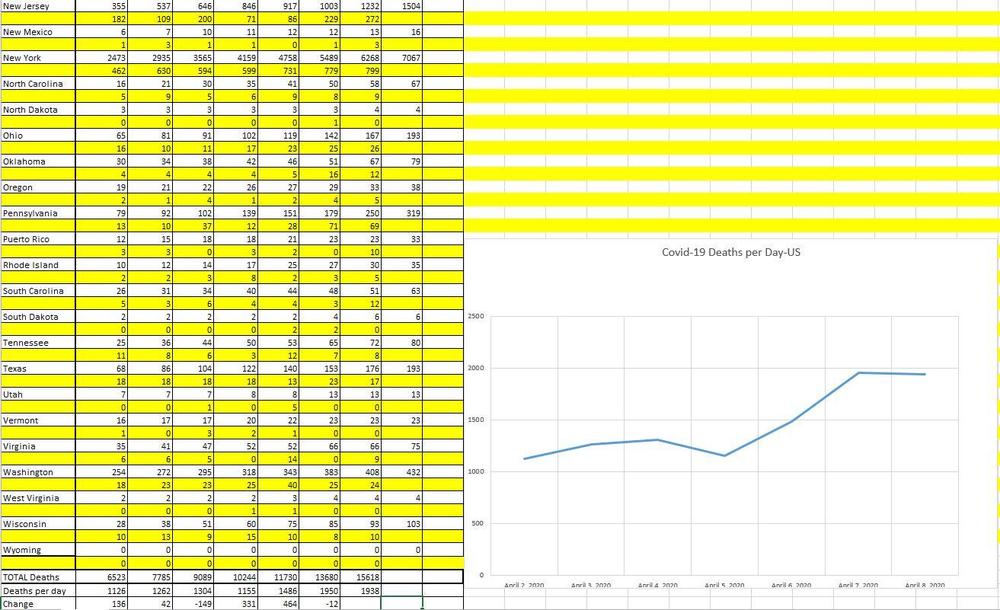
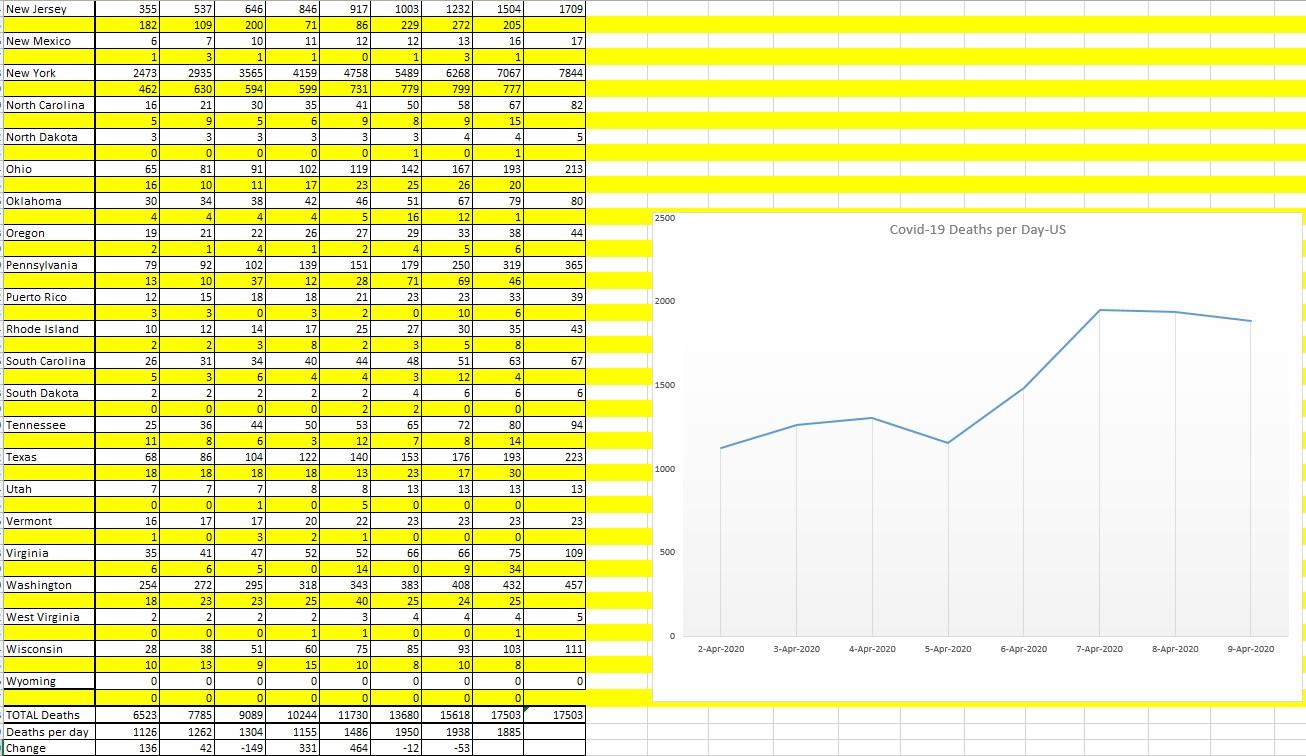
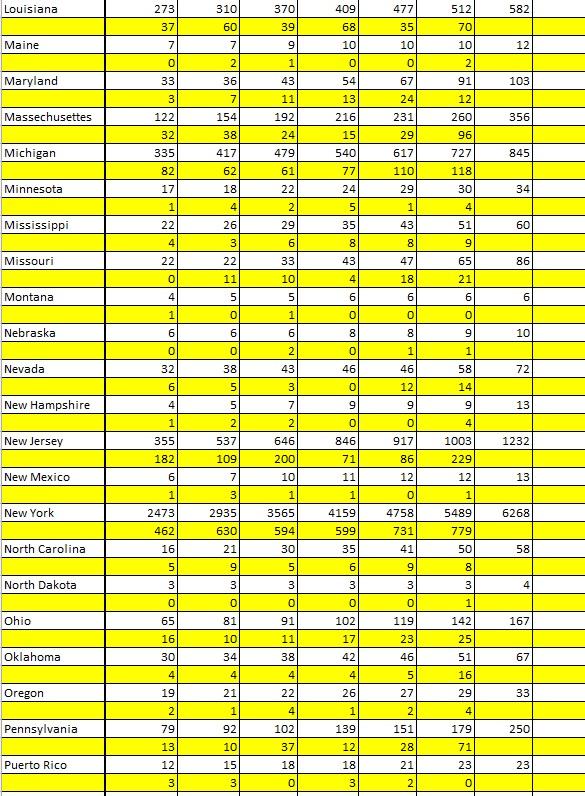
Here is the chart with yesterdays numbers. Most states were pretty flat across the board except for Virginia, Maryland and Indiana which showed significant upticks. New Jersey had a significant drop and New York showed a slight drop which is the reason for the lower number of deaths for April 9th. New York and New Jersey together still comprise over 50% of the daily deaths in the US. Michigan seems to be flattening which is good. California and Illinois were also flat. This is the second day in a row that we have seen a reduction in total death for the day in US. Let's hope we can keep that trend going.
-
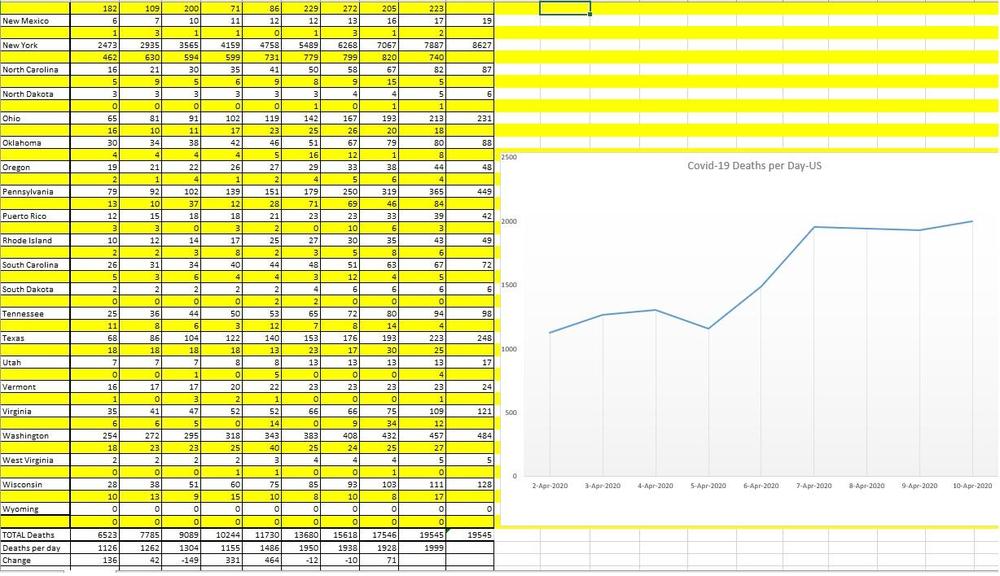
Here's the chart with today's numbers. Not much different than yesterday as total was just slightly lower. New York and New Jersey still have the lion's share of the the deaths with over 55% and both posted a slight uptick from yesterday. Most other states were flat except for Illinois which posted a slight uptick.
-
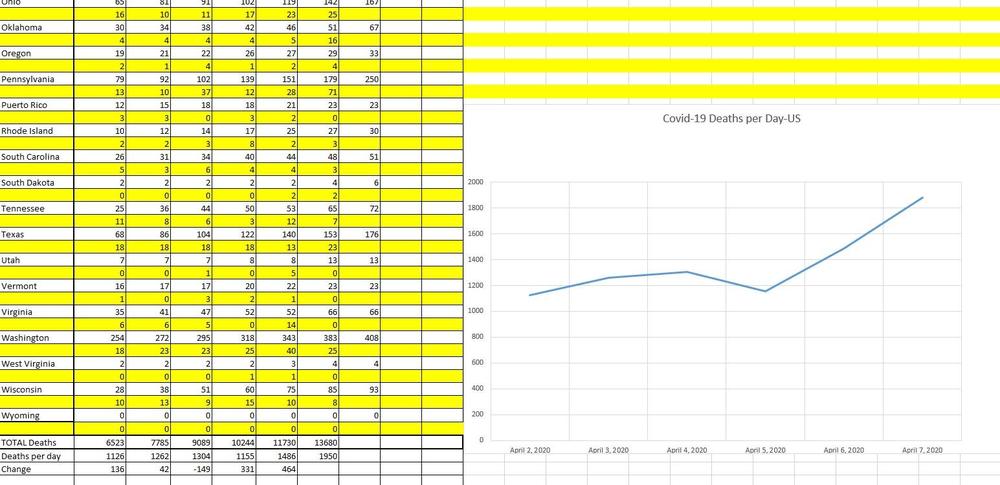
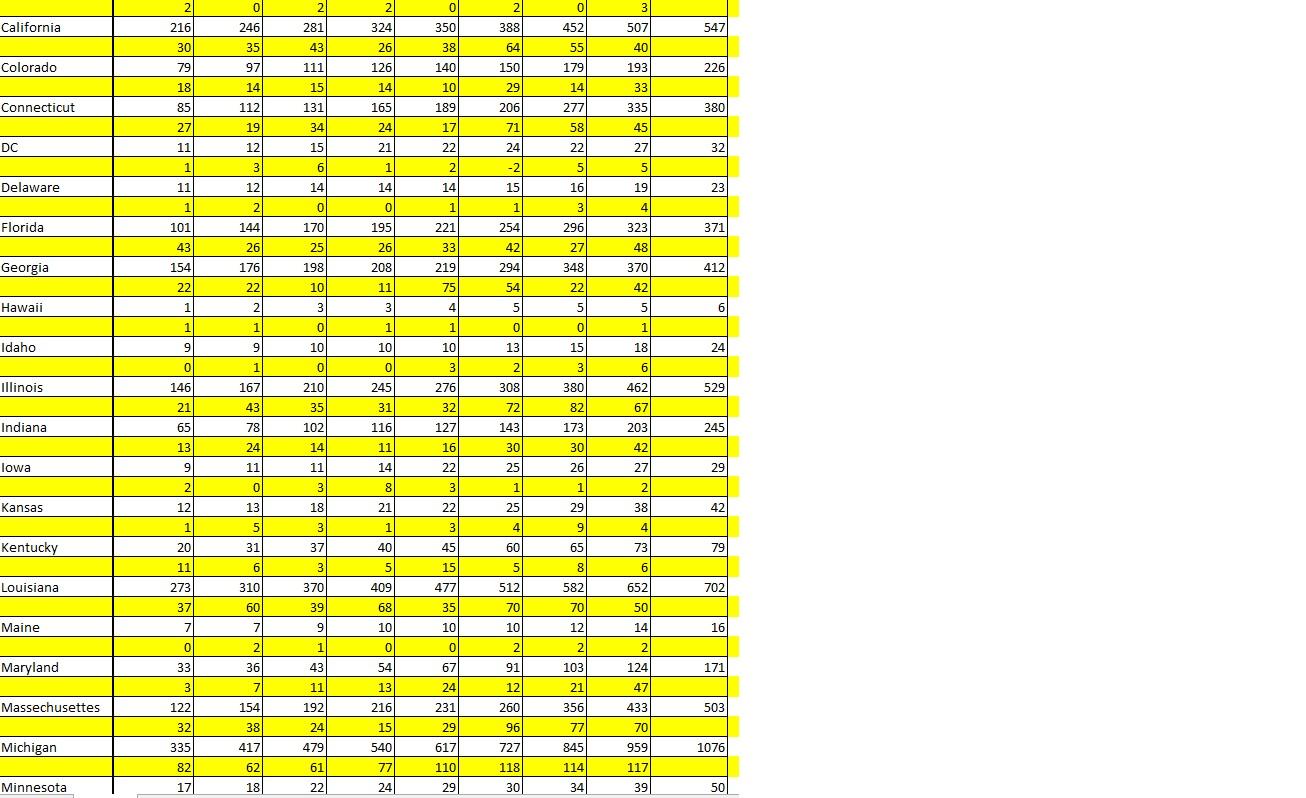
Yes, and looks like they have updated their data so it is now more in line with the Hopkins data. ____________________________________________________________________________________________________ Yesterday was a pretty bad day with the deaths jumping up to 1950 for April 7th. Also, looks like New York's numbers the previous day were not a blip but a significant step up. Between New York and New jersey alone, there were over 1000 Covid deaths yesterday, more than half the Covid deaths in the US for April 7th. That whole region is really a very bad area. Massachusetts, Connecticut, and Pennsylvania were also big contributors to the total. All three showed significant jumps from the previous day. The other significant changes were Illinois and California, both registering their highest deaths for one day because of the virus. Texas also registered a high for Covid deaths, but not as ramped as Illinois and California. So, this is where things start to get bad as these are the other three most populated states, albeit a little more spread out and not with the mass transit factor. Louisiana, also registered a daily high as well. Given that the large population states are ramping up, things will be pretty ugly for a while. Hopefully the regional epicenter of New York, New Jersey, Connecticut, Massachusetts and Pennsylvania will stabilize soon.
-
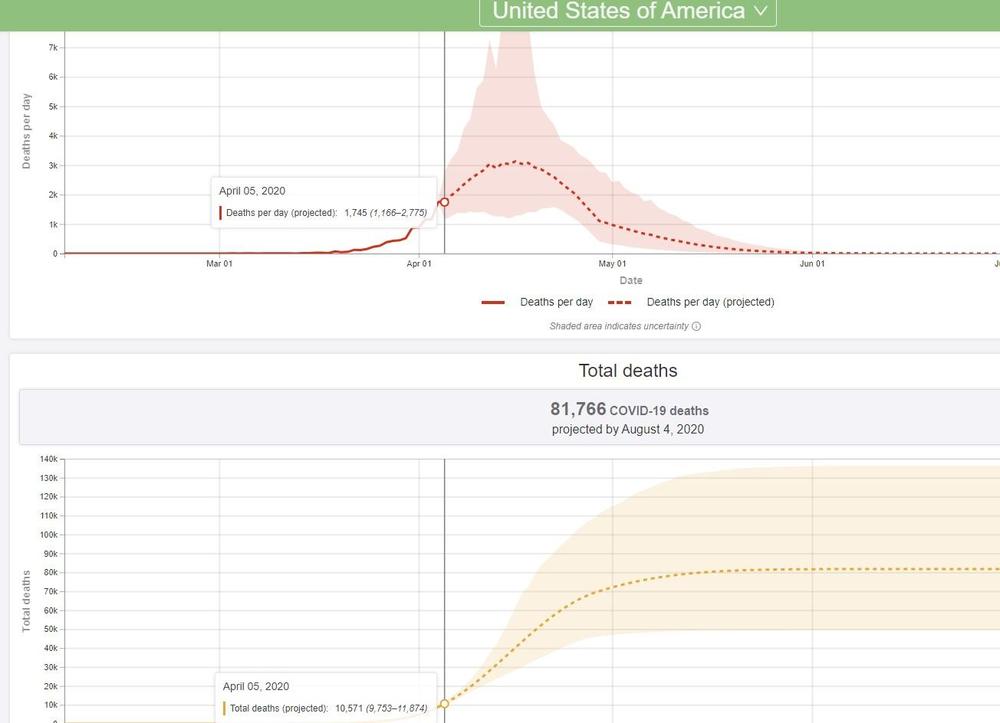
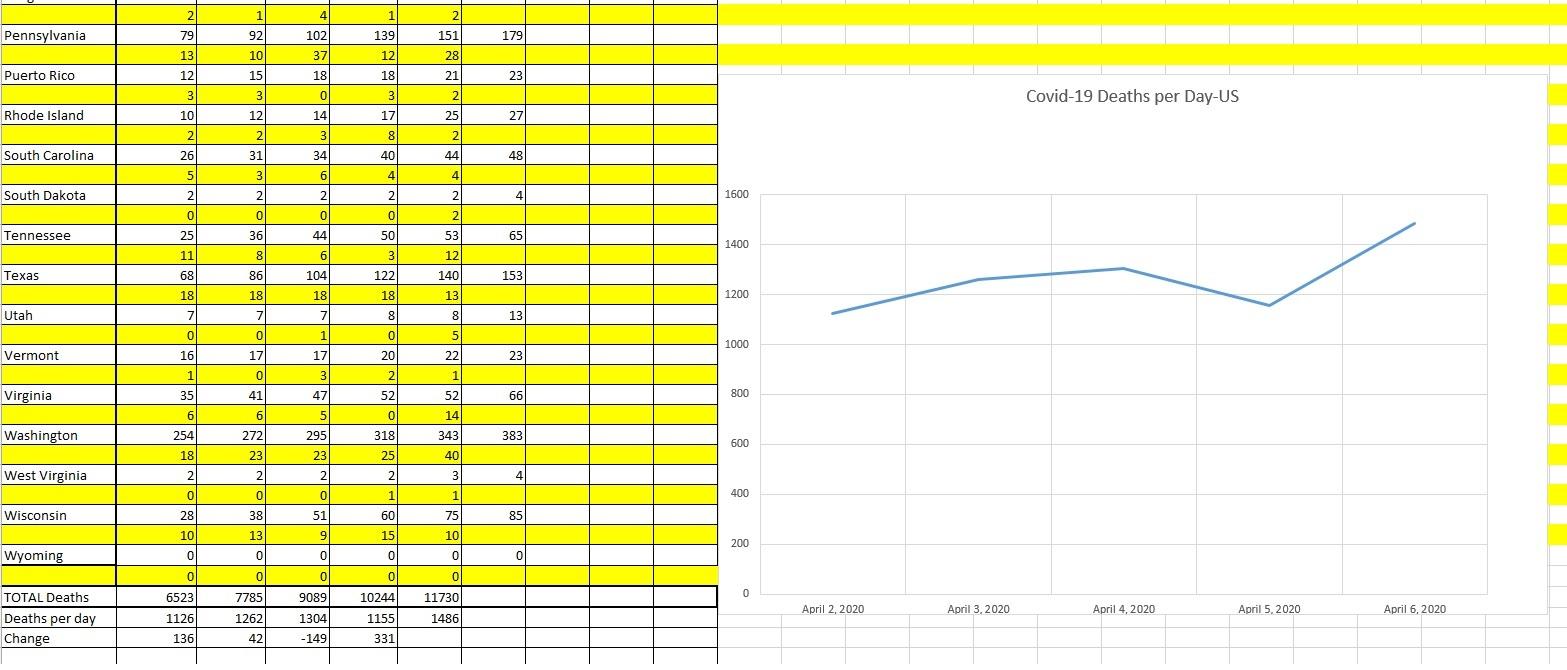
Actually, I think their work is pretty poor and I don't think Europe will want them. Here are the problems that I see: 1) Their high projections need to be re-evaluated, they are way off. 2) Their daily death totals on April 2 were 600 people too low, by April 6 their total is over 800 people too high. (Based on John Hopkins numbers and what is being reported) 3) The huge jump in Daily deaths from April 3 to April 4 was to play catch-up and get the totals right. Unfortunately, they kept that large value which has caused them to far exceed the current death total (by 800) 4) At no time has the US daily death total reached over 1700 and they have that number twice. I show the highest total as 1486 which was yesterday. We may reach 1700 in 3 to 5 days. That being said, not impressed with the work. Also, the high and low curves should be much smoother due to the overlap of 50 states. The steep drops show that they have errors/inconsistencies in their model. _______________________________________________________________________________________________________________________________________ Also for what it's worth....from the charts: New York had it's worst day yesterday, not a good sign. Hopefully it is just a blip in the numbers. Michigan had a bad day and hopefully the rate starts slowing. They are starting to go vertical. The surprise was Georgia, big jump from the previous days, from an average of around 15 up to 75 yesterday. Maryland, Ohio and South Carolina are starting to ramp. Hopefully that does not continue. Wyoming is still our glimmer of hope with 0 deaths still.

-
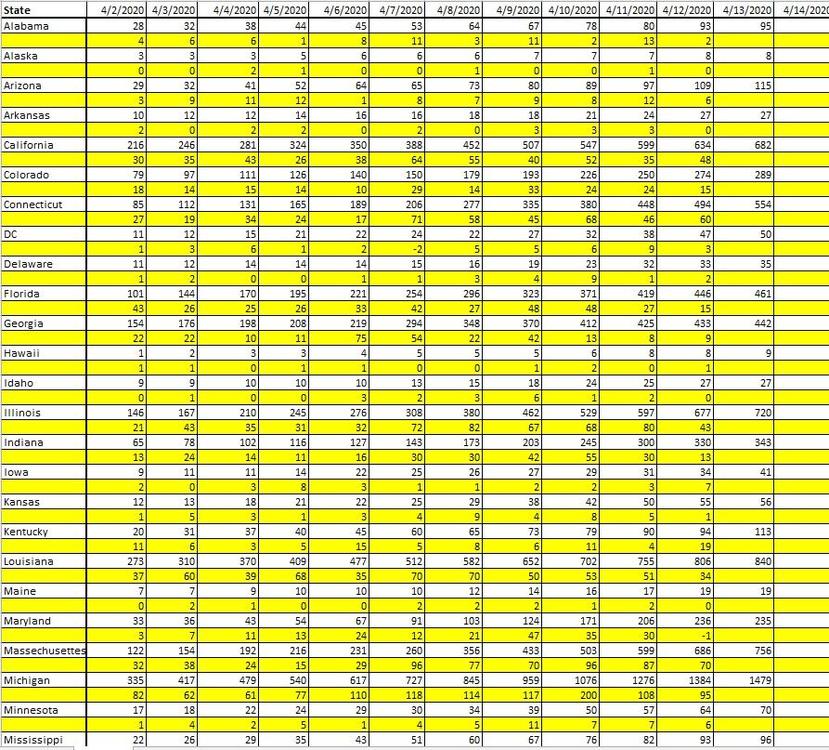
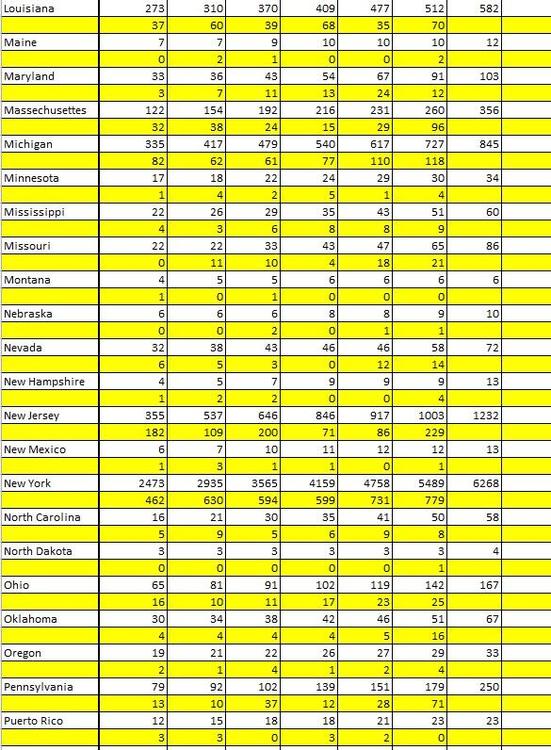
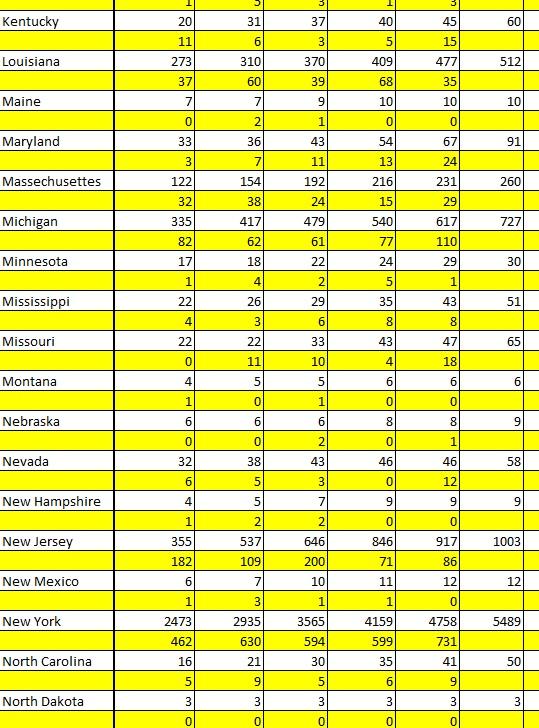
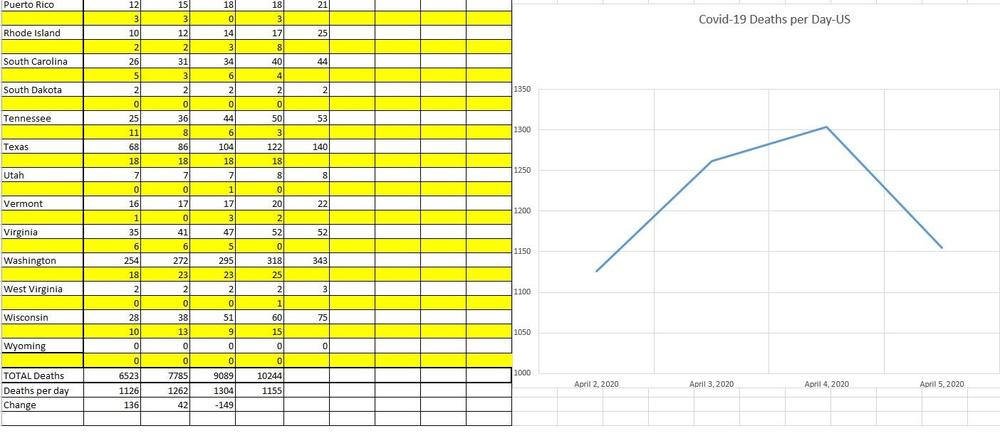
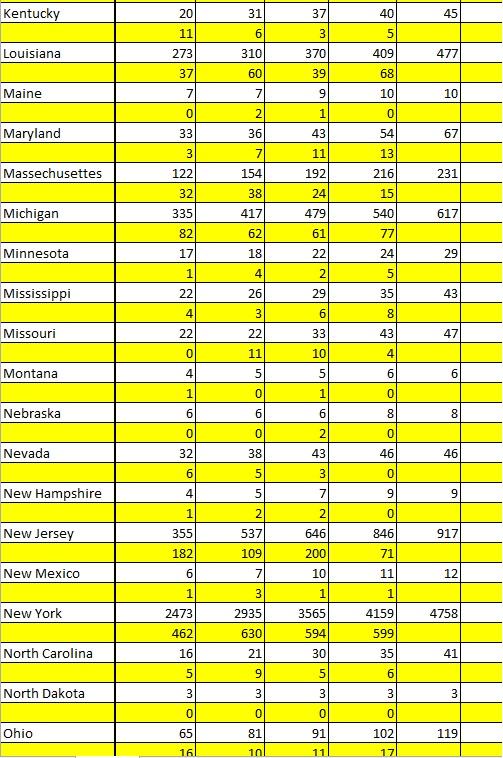
I started graphing the John Hopkins numbers last week just to get a better idea of what is really happening in the US with the virus. There is a lot to be learned about the change in death totals in each state that give a good picture of what is going on. From the numbers: New York, New Jersey, Michigan and Louisiana are the big contributors to the daily death totals. New York seems to have leveled off, same with New Jersey and Louisiana. Michigan is going through a bad spell right now. The reason for the drop in deaths for April 5th was primarily due to New Jersey's lower numbers. I would say that most other states were relatively flat with California posting a drop. I think the high projections thought California, Texas and Illinois would be much worse. California is surprisingly low, fortunately. I owe Gavin an apology. Datawise, I try and record all data around 8AM Pacific time, however, New York updates around 10AM so I add them in later. Some states seem to update throughout the day...some just once a day. Wyoming still has 0 deaths. I think that says something about those wide open spaces. I also compared the John Hopkins totals with the Covid healthdata numbers. They are fairly close, but seems like Covid may have taken the weekend off as they are not as 'smooth'. https://covid19.healthdata.org/projections I did not chart confirmed cases, because that number is limited by test availability. I am expecting tomorrows numbers to be higher because of New Jersey and Michigan late day updates, but New York will have the final say. I think the market rallied today because of the one day drop. Don't know if that will continue tomorrow. On the Excel charts, totals are in white, daily change in yellow, start date is April 2.
-

Virus face shields, masks - ideas and designs
motorman7 replied to Zed Head's topic in Open Chit Chat
I think the trick will be to make it such that face masks are "cool', 'dope', 'Sic' or whatever the current 'hip' term is. Management at work has set up a contest to see who has the best looking face mask. The wives and seamstresses have been busy here. Went to Costco last Friday and saw the same thing you mentioned. Some people just don't care, and it's not just the young ones. -
I think this is a great article. https://www.yahoo.com/news/sweden-found-solution-coronavirus-103003618.html Also this one https://www.washingtonexaminer.com/news/two-academic-brothers-have-a-plan-for-putting-the-country-back-to-work-in-just-weeks Time to start looking at solutions on how to exit this quarantine instead of running around and pointing fingers. The way we move on from this point is very key.
-
Virus face shields, masks - ideas and designs
motorman7 replied to Zed Head's topic in Open Chit Chat
I use this mask when working on the wire wheel or when grinding and debris is flying. Super comfortable and quick to put on. I do, however, hate the ear plugs because they get tangled too easily- so i cut them off. I use big ear muffs instead. -
To buy or not to buy...that is the question
motorman7 replied to motorman7's topic in Open Discussions
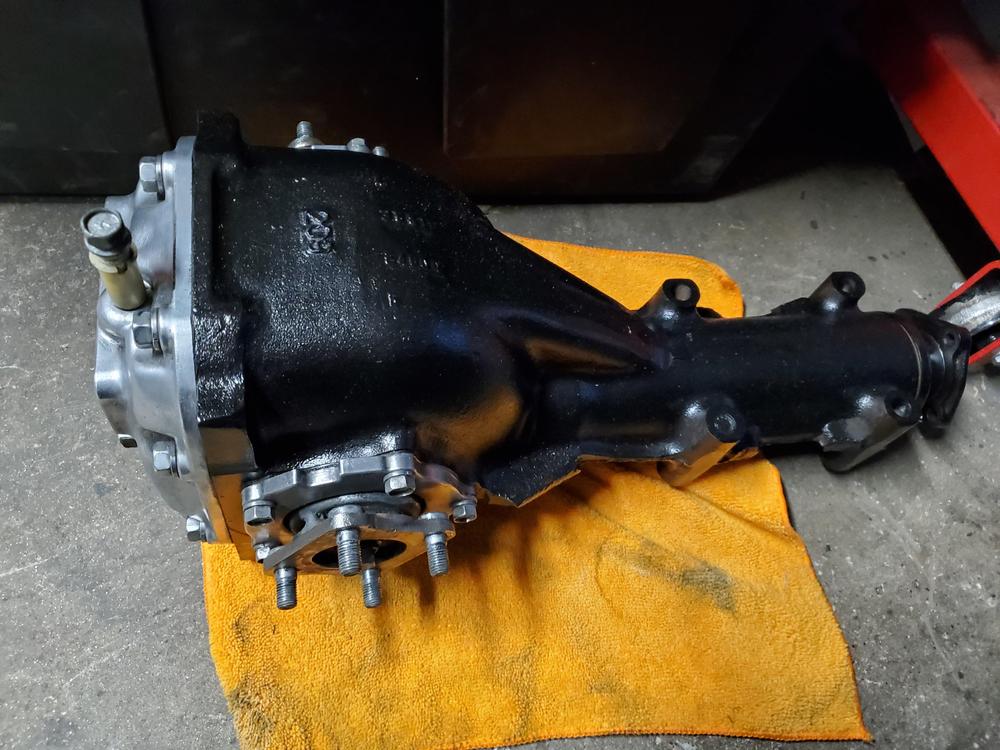
Got the differential cleaned up and painted.

-
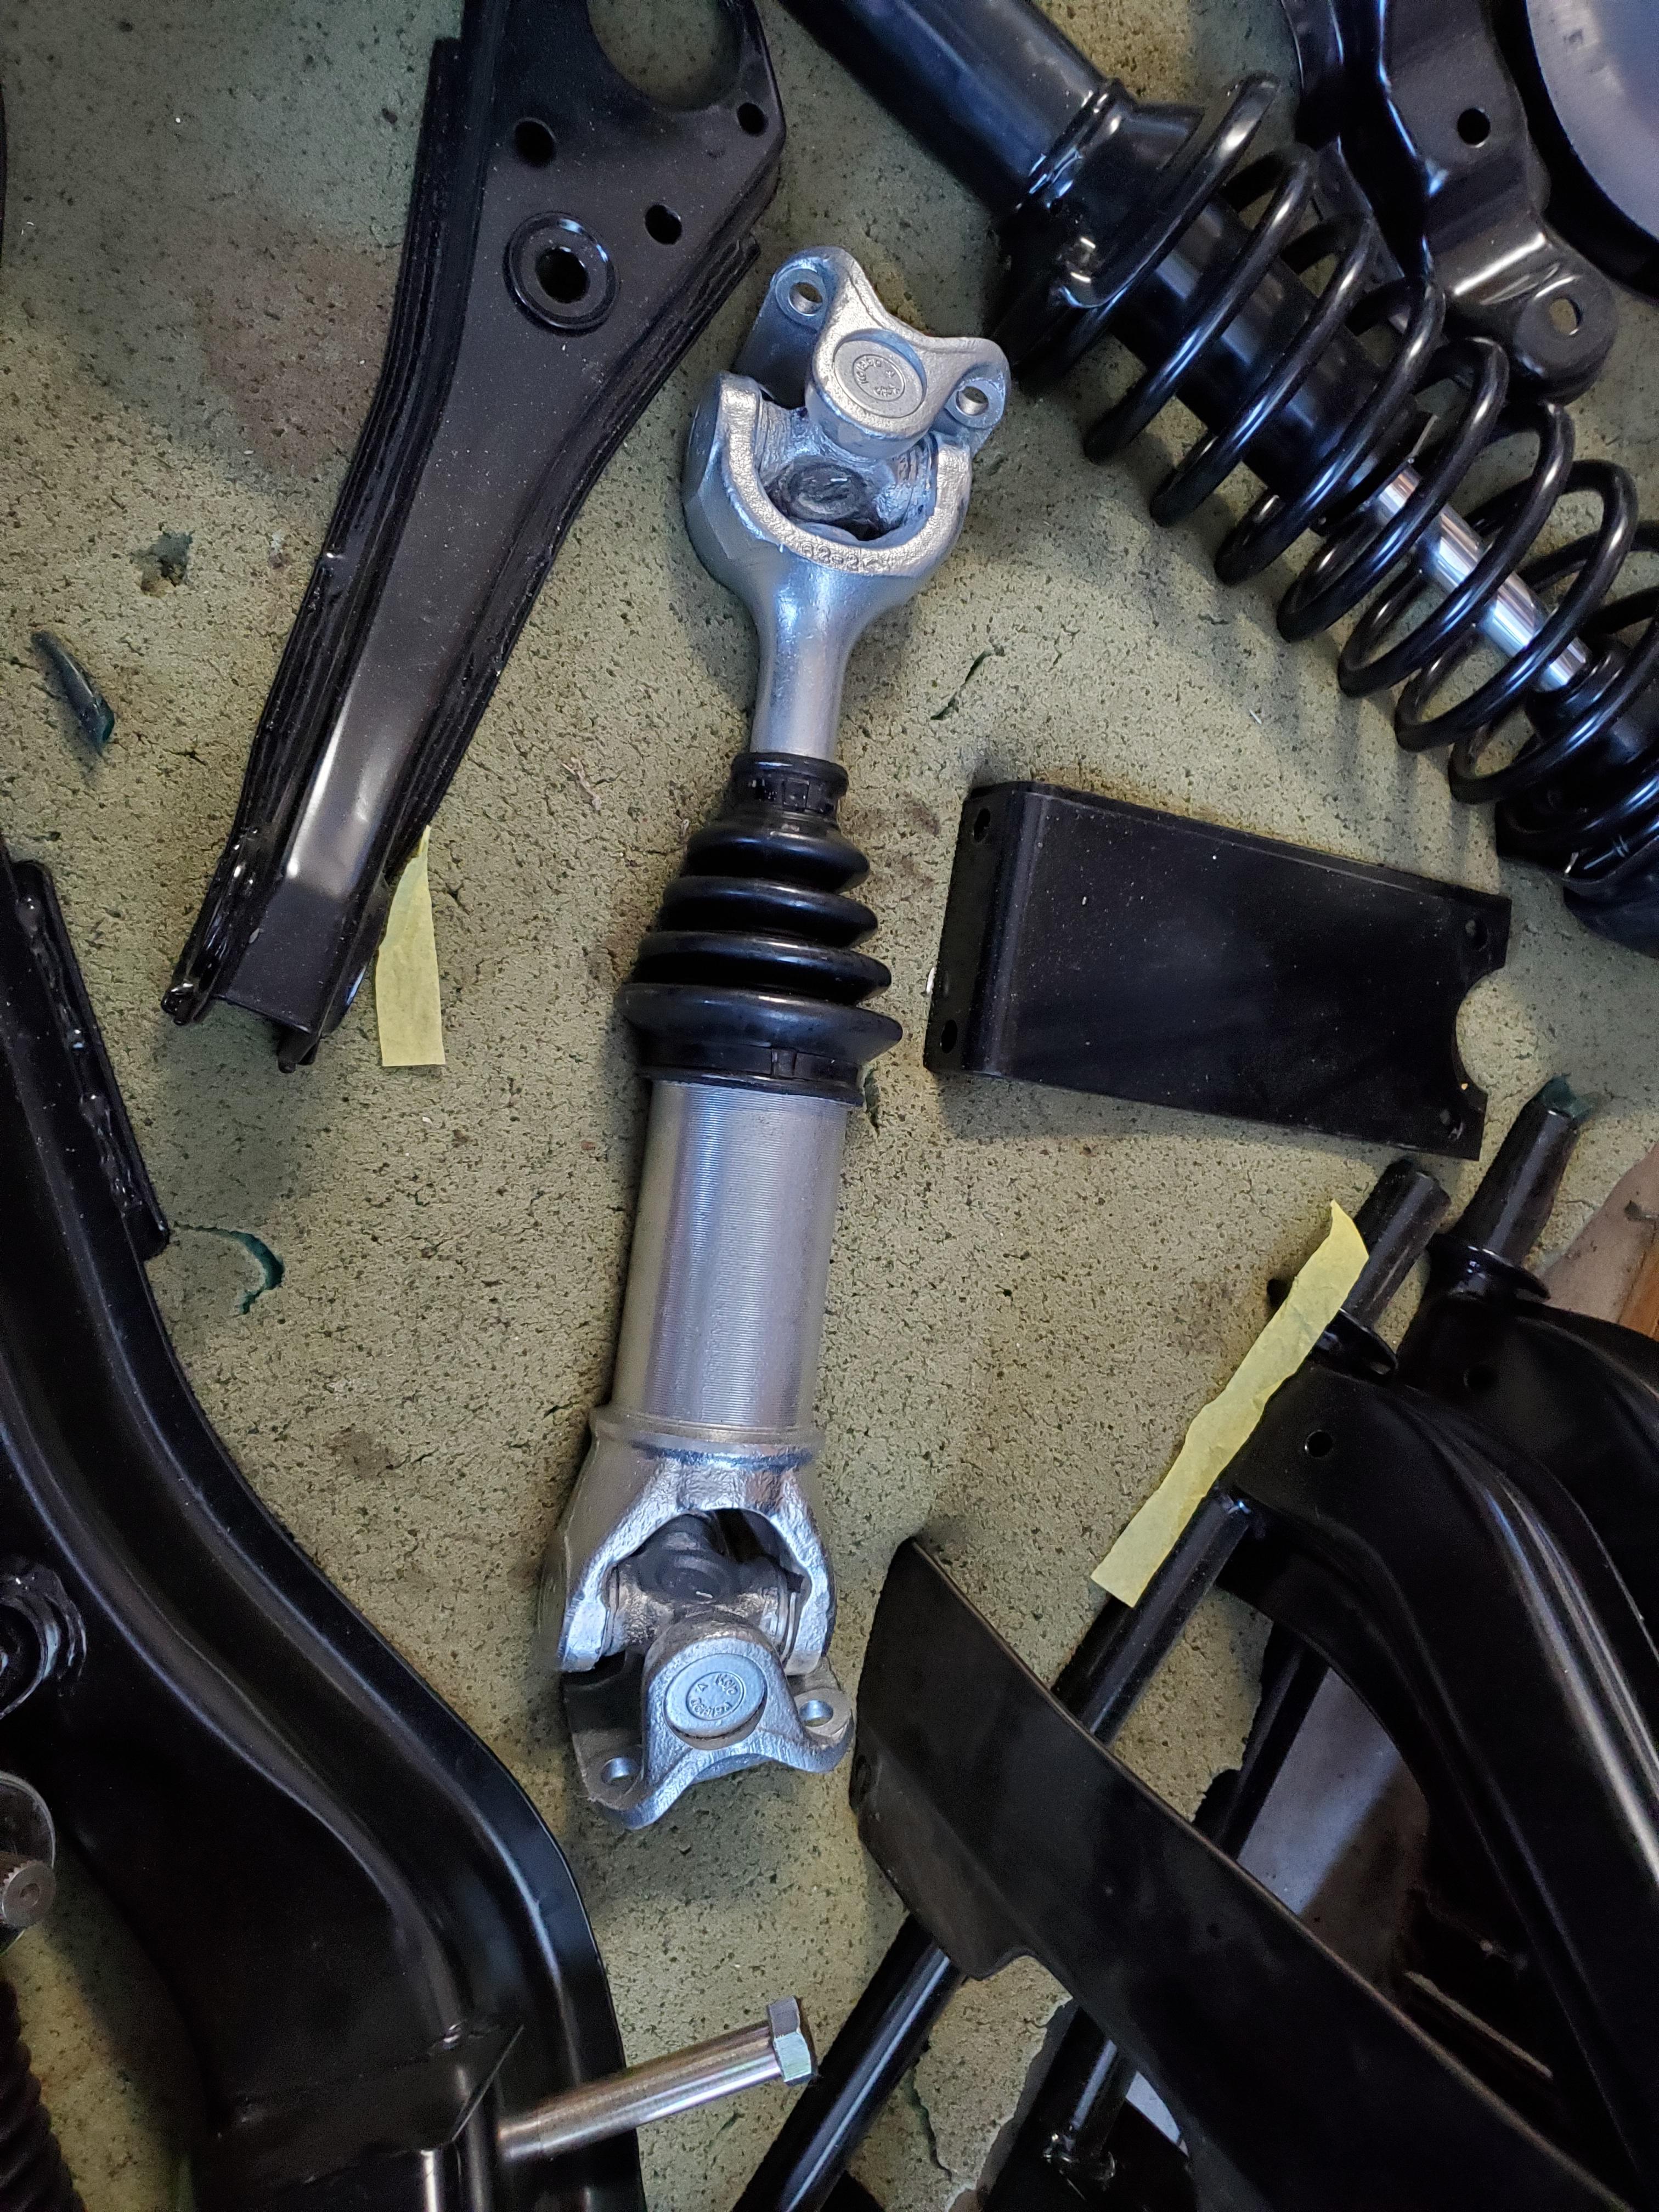
Cleaned and painted the drive shaft today......now I just need a car ?
.thumb.jpg.8c522e33e9d2fcc8d9add6cb0559c5c0.jpg)

-
Same here. This is always the longest part of the project. Engine, suspension and drivetrain are all ready to install once the body shows up.
-
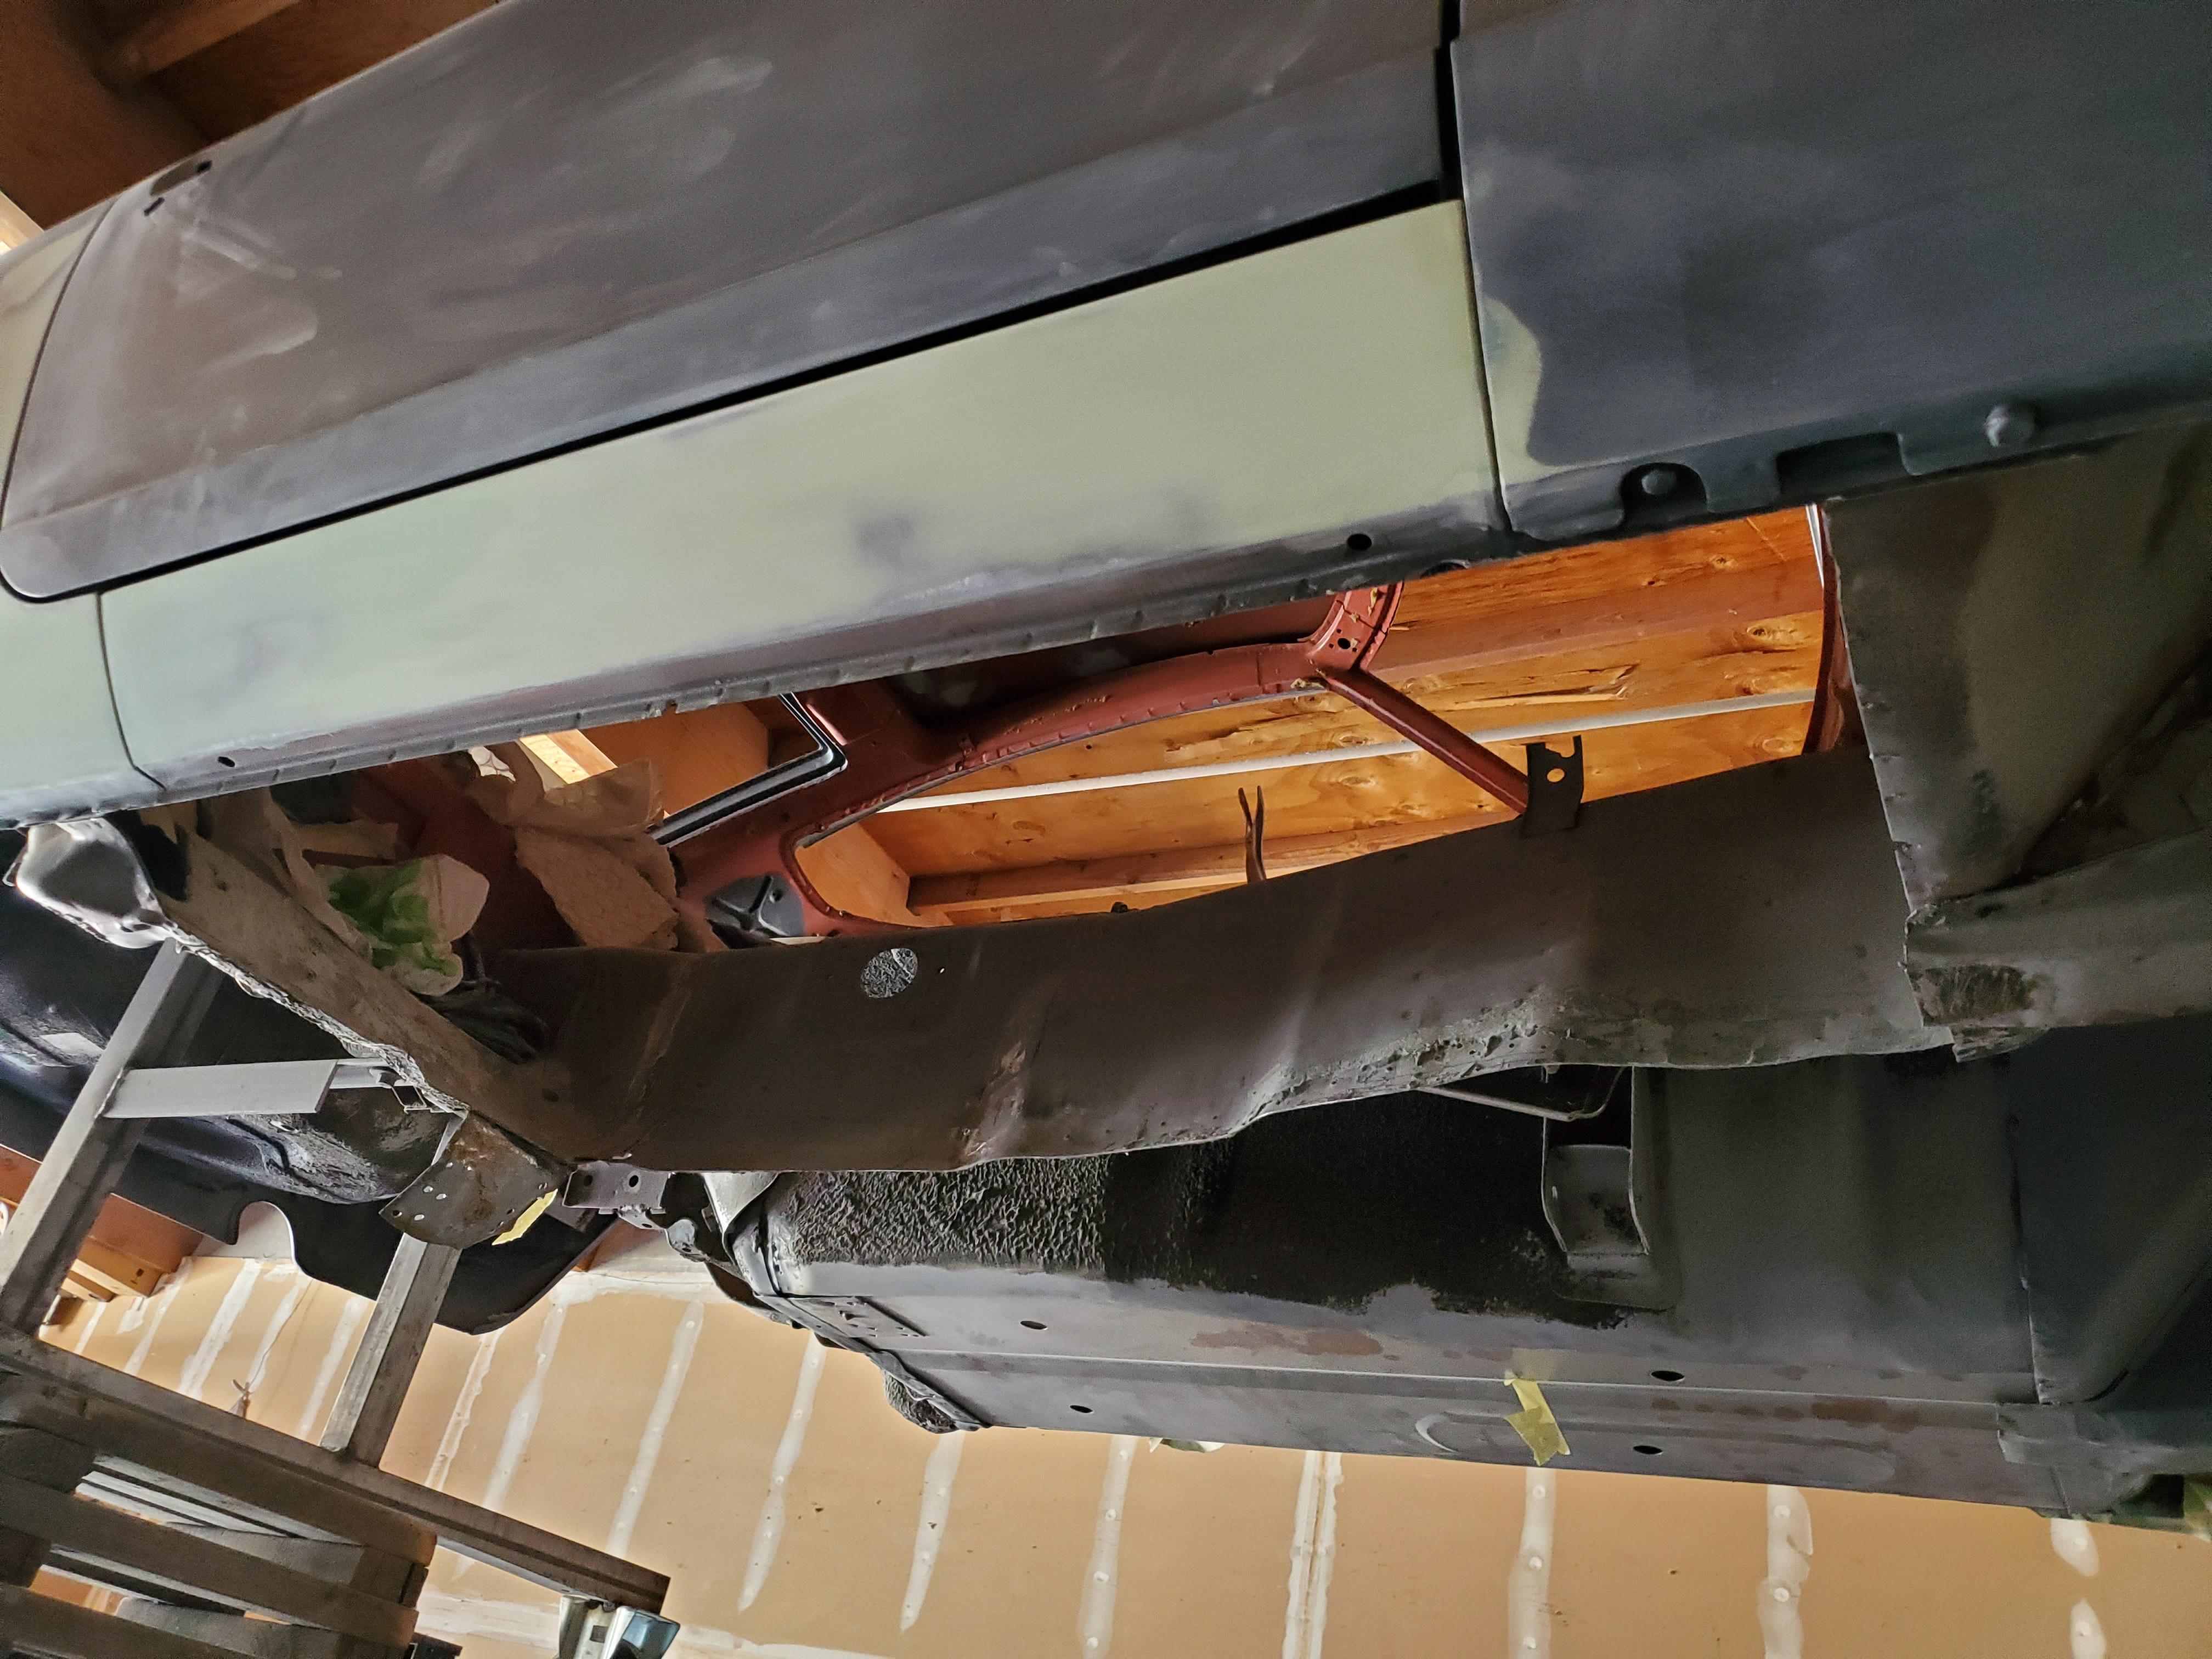
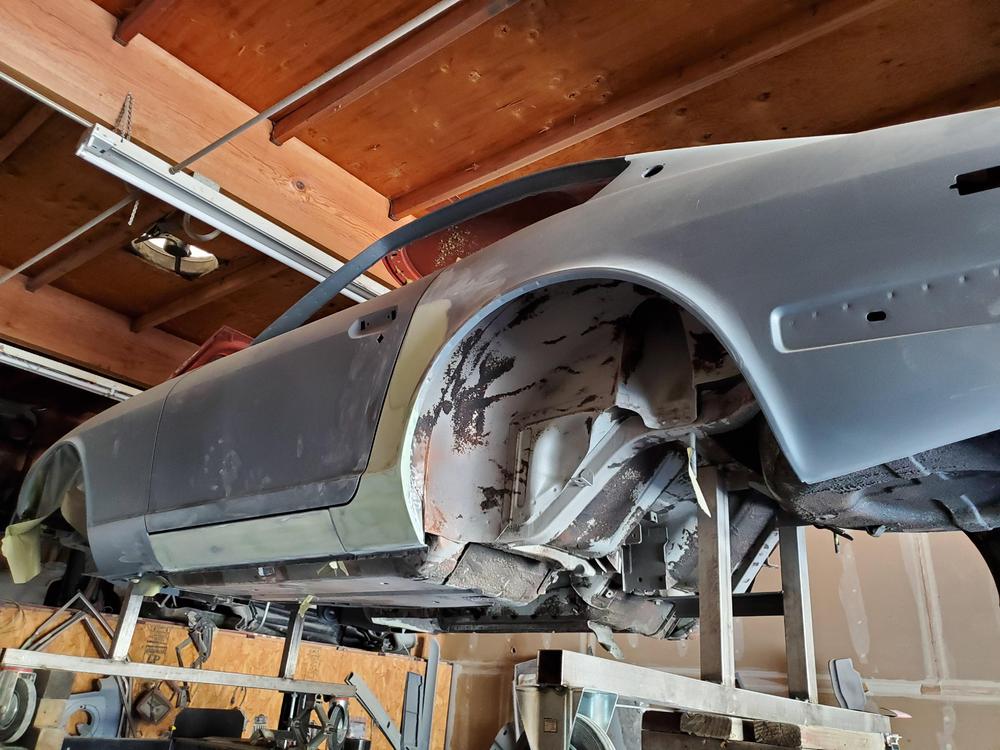
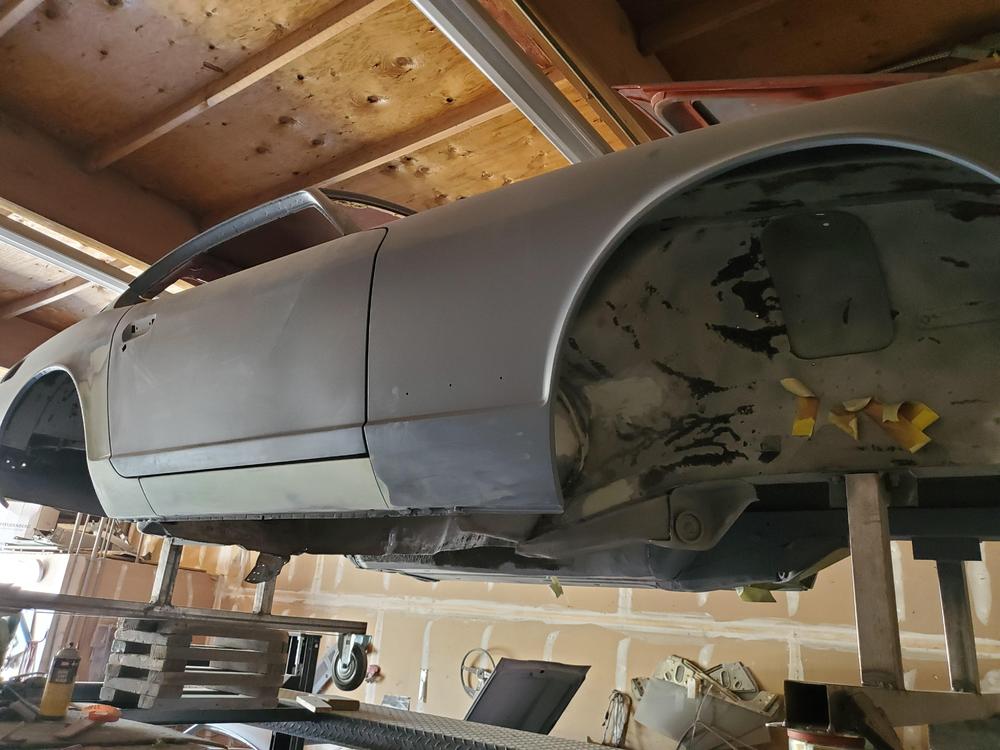
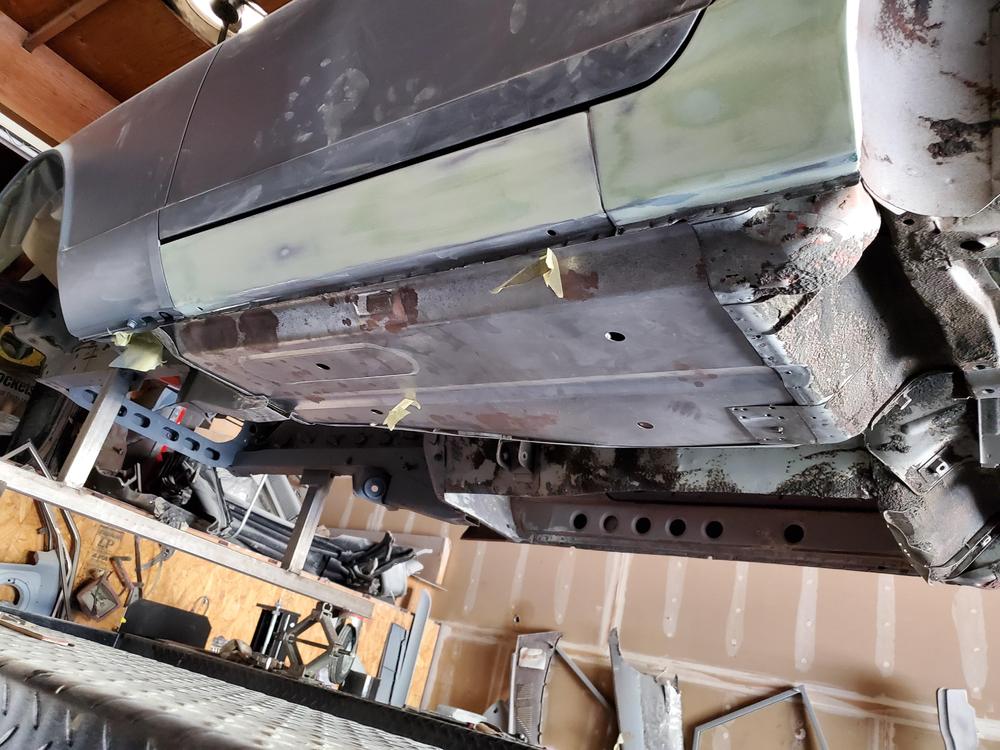
Here are the latest pics from the body shop. We are pretty far along on the outside portion of the body, doglegs and inner panels have been fixed along with a number of other rust areas. Once the floor pans are finished up we should be in pretty good shape.

-
Will be interesting to see how they lift the shelter in place decrees. This article brings up some good points. https://www.dailywire.com/news/professors-push-back-on-pandemic-models-be-honest-about-what-happens-after-lockdowns-are-lifted Just an idea: given the state of our economy and unemployment, I think it would be smart to lift the shelter in place at the end of April starting with those individuals that are 30 and under. Would be nice to get movies and restaurants open (and other businesses), while still applying some form of social distancing. Maybe every other table empty at restaurants, two seats in between movie goers. I would still restrict large group gatherings. Then after two weeks, make the age restriction 35 and over...and so on every two weeks. (So I will be waiting a while here, for what it is worth). There needs to be some way of portioning out the herd-immunity without overwhelming the medical system, assuming a vaccine is not available in short order. Somewhat unrelated: The geek in me has now set up an excel chart to track and graph the deaths in each individual state to see where each state is at on the bell curve. Also, will be interesting to see if we get 'double bells' (two side by side bells) when lockdown ends. Unfortunately, this is going to get very ugly over the next two weeks. The US confirmed cases already tell that story.
-
Yes, it was a glitch, that's why I took the screen shot. Just surprised me to see their data missing.
-
Looks like the US just found a cure. Here is the latest John Hopkins update. Note time stamp in lower left corner. https://coronavirus.jhu.edu/map.html

-
This thought keeps running through my mind...If we shelter in place real well, does that mean we get to shelter in place longer? Since we are trying to flatten the curve, the better we shelter, the flatter the curve. I don't think our country will have that problem, but it does give you something to think about. From the numbers, it looks like California has done a pretty good job so far based on the low numbers relative to population size. I do, however, think this is the calm before the storm for CA. We are just now starting to ramp up and will probably start seeing New York sized numbers by the beginning of next week.
-
To buy or not to buy...that is the question
motorman7 replied to motorman7's topic in Open Discussions
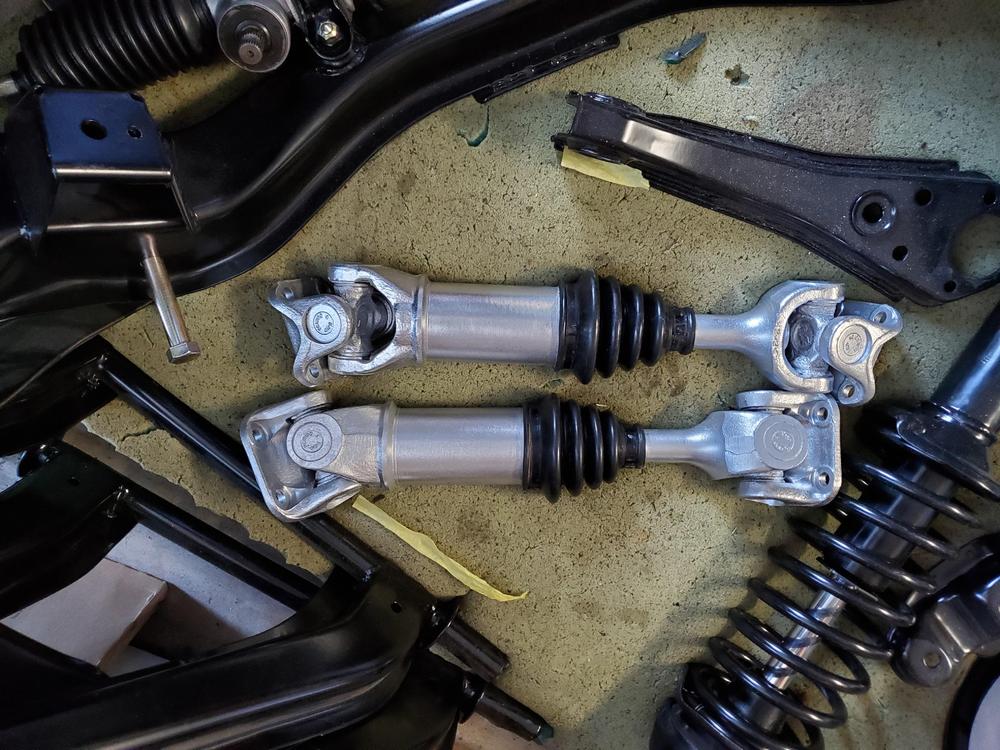
Cleaned and painted the CV shafts this weekend. I painted them with 'aluminum' spray paint which I think may be a bit too shiny. May re-do this in flat aluminum.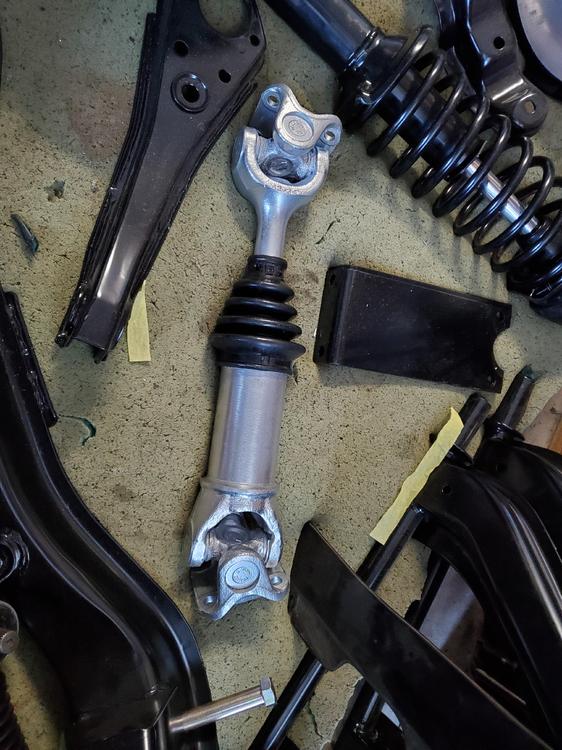
-
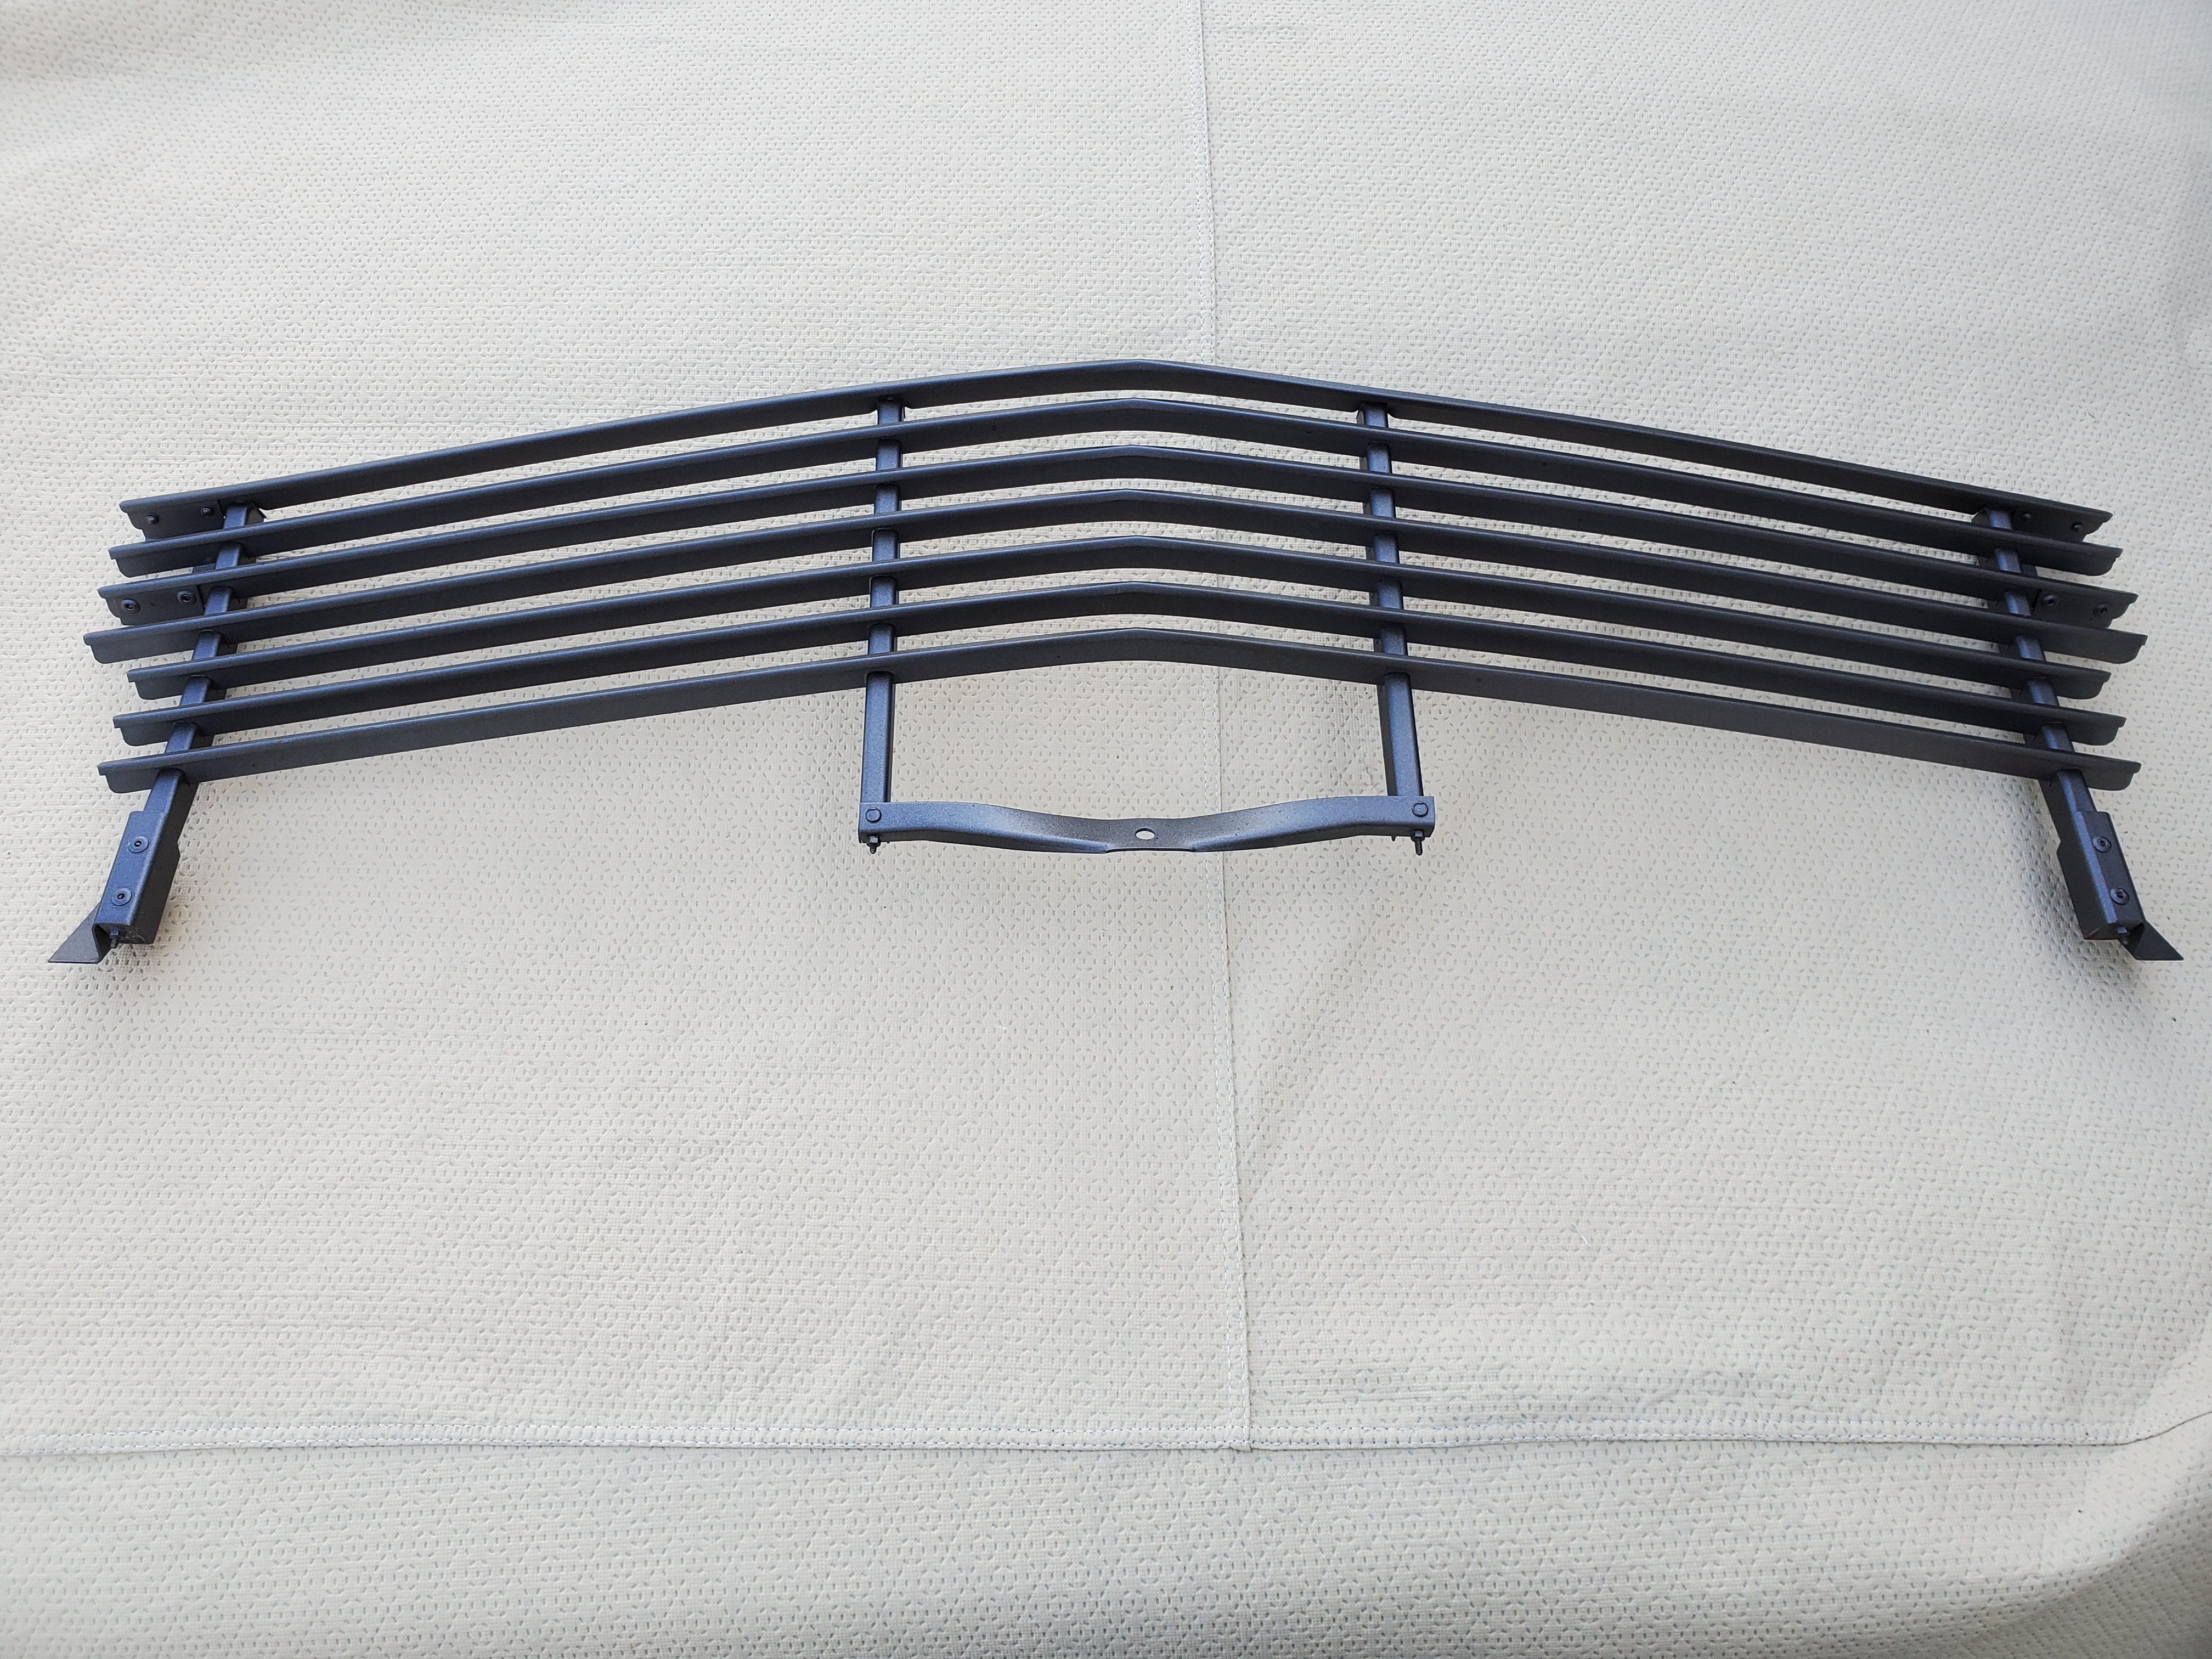
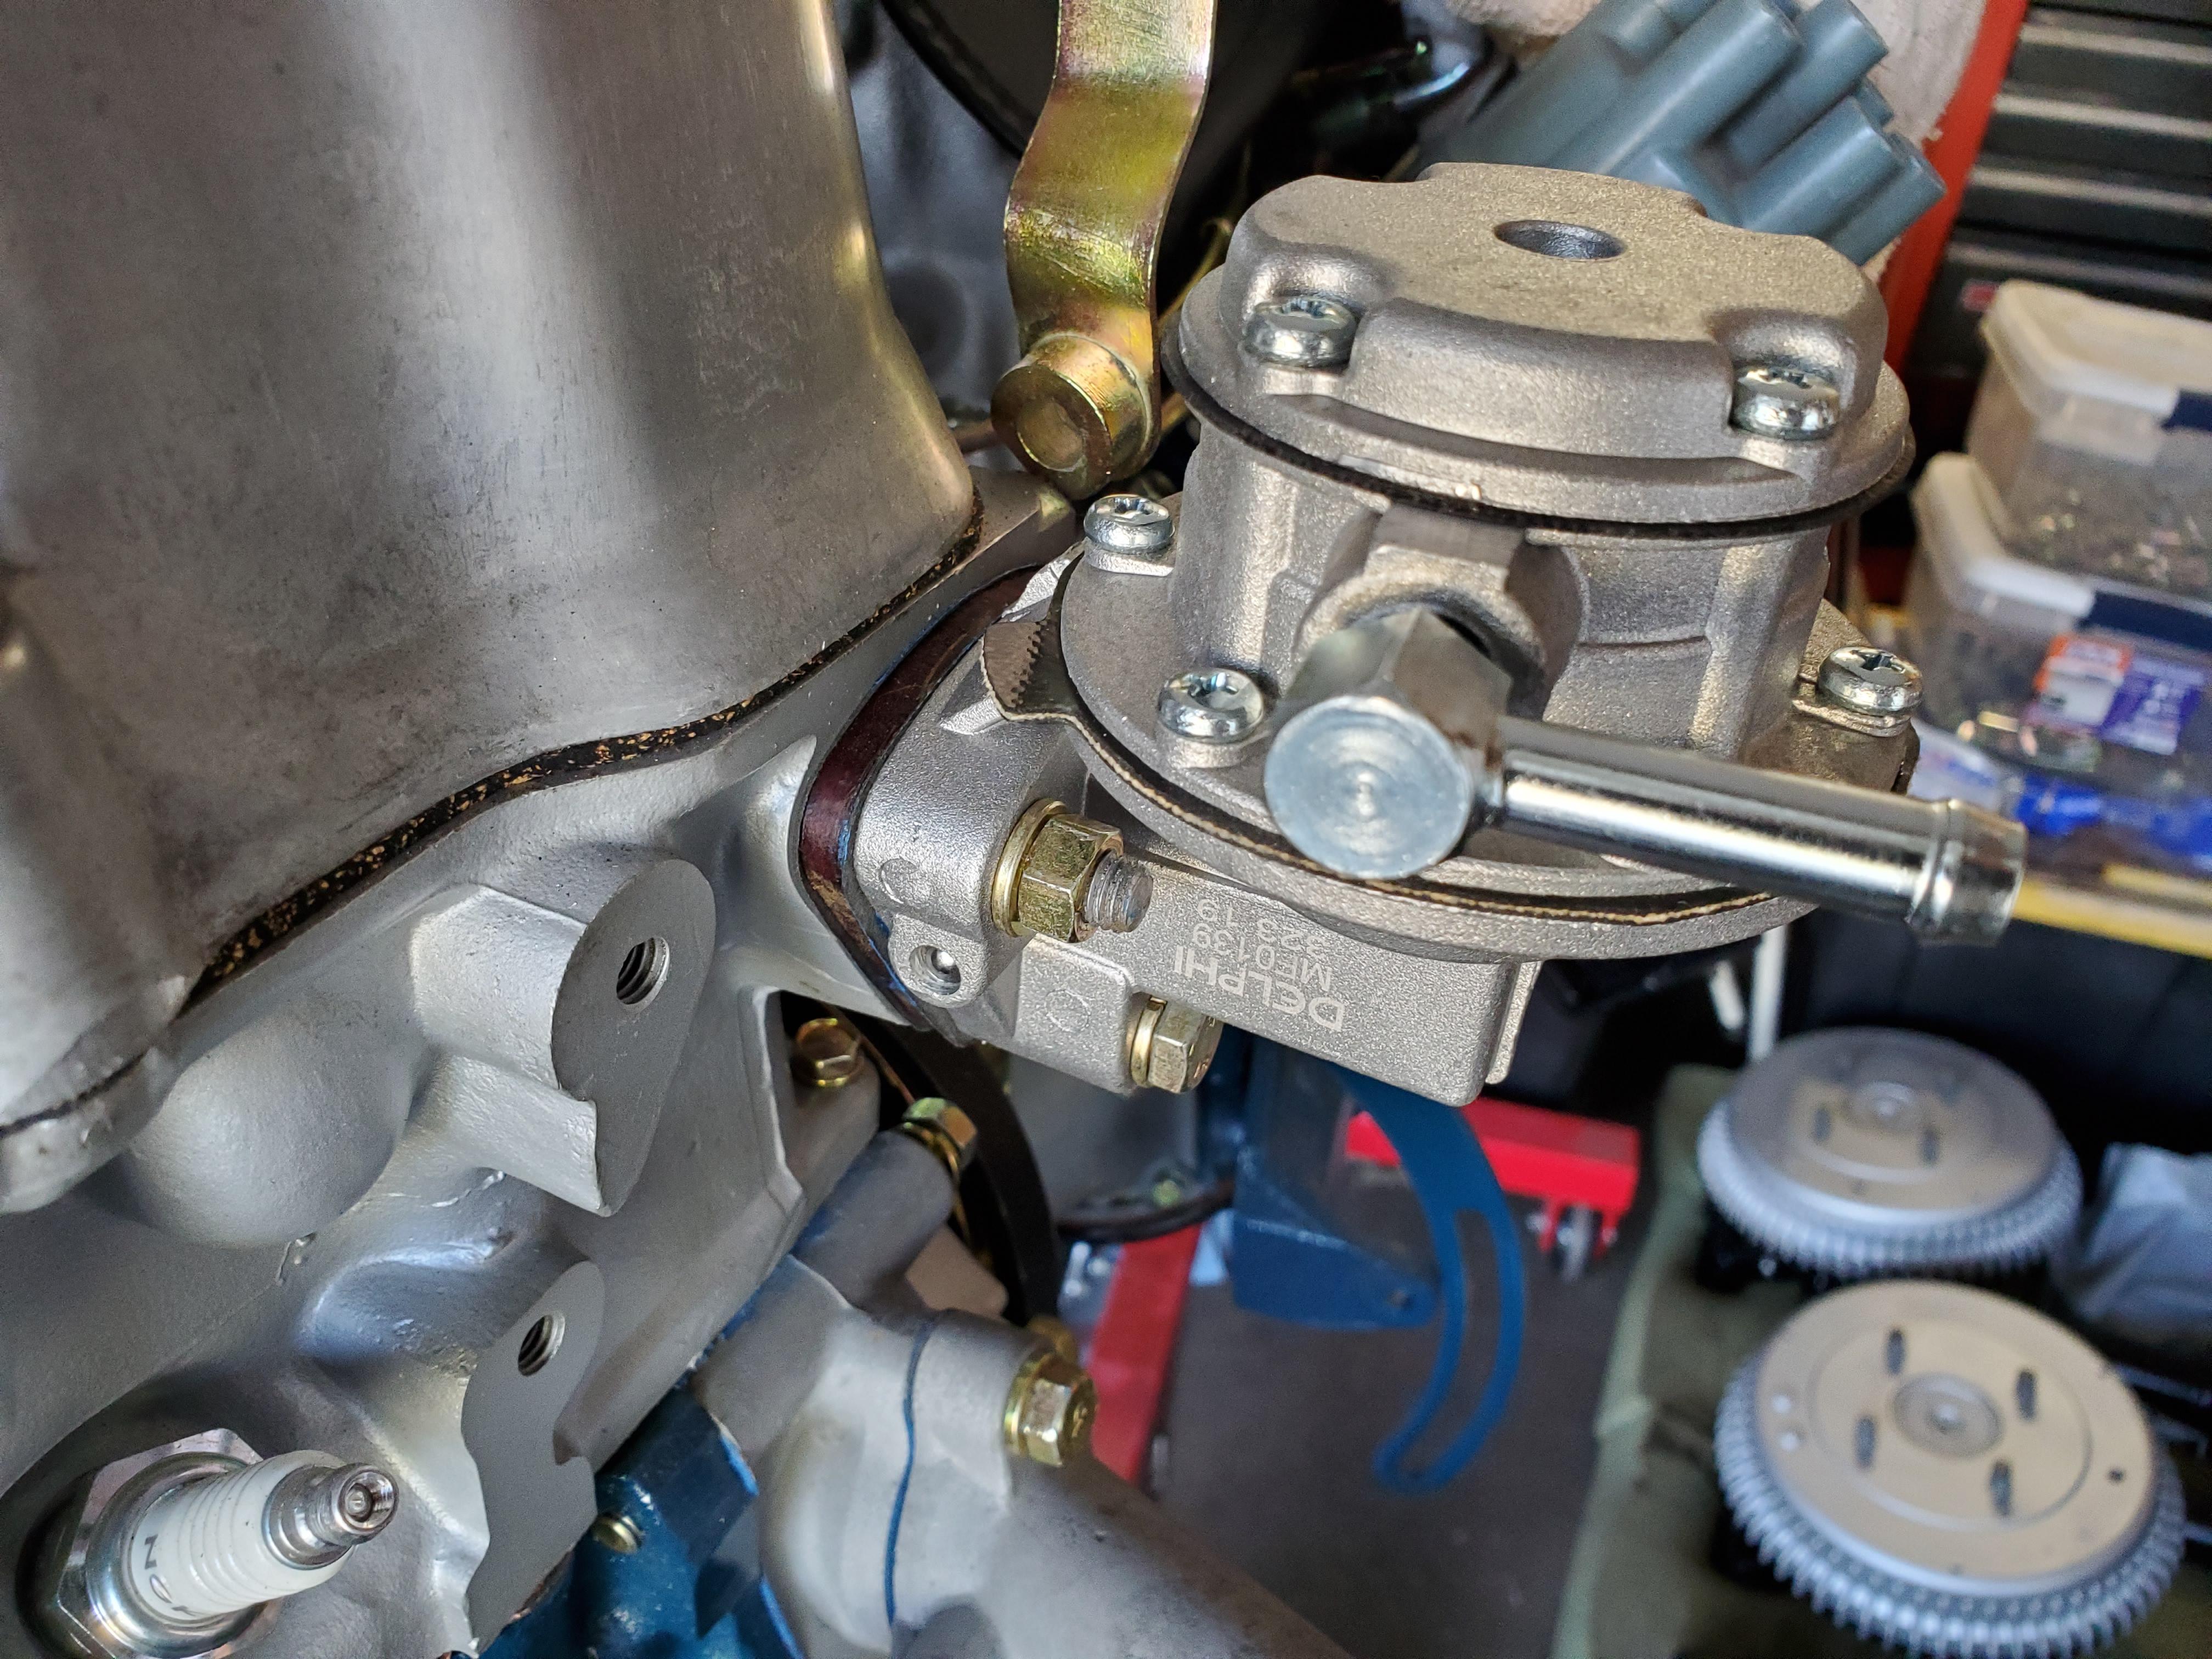
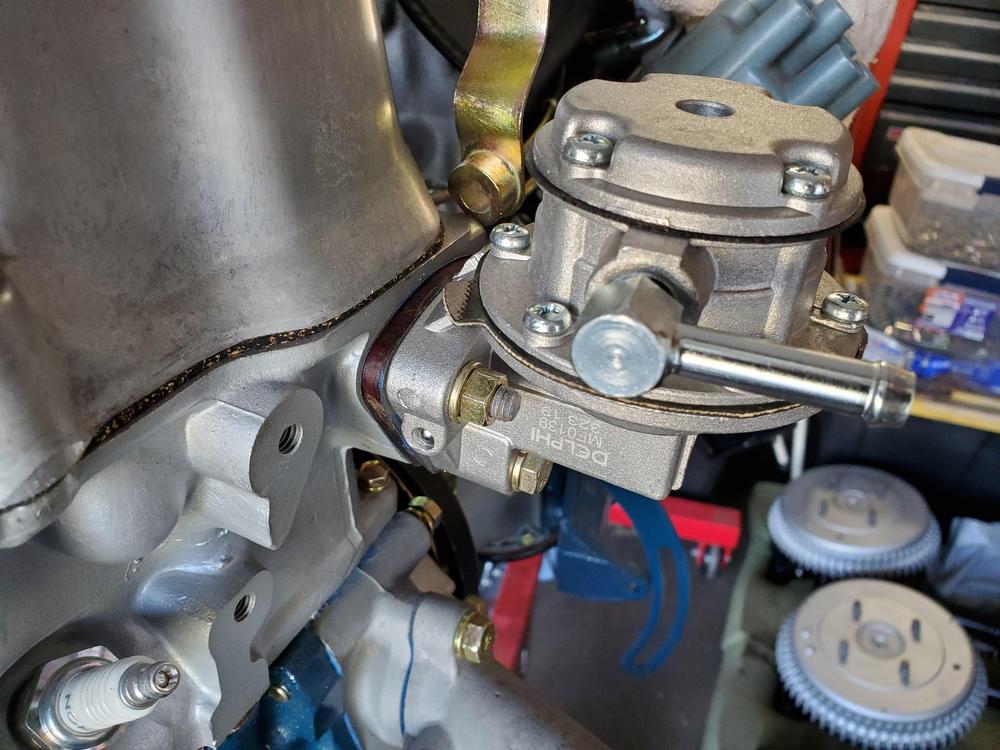
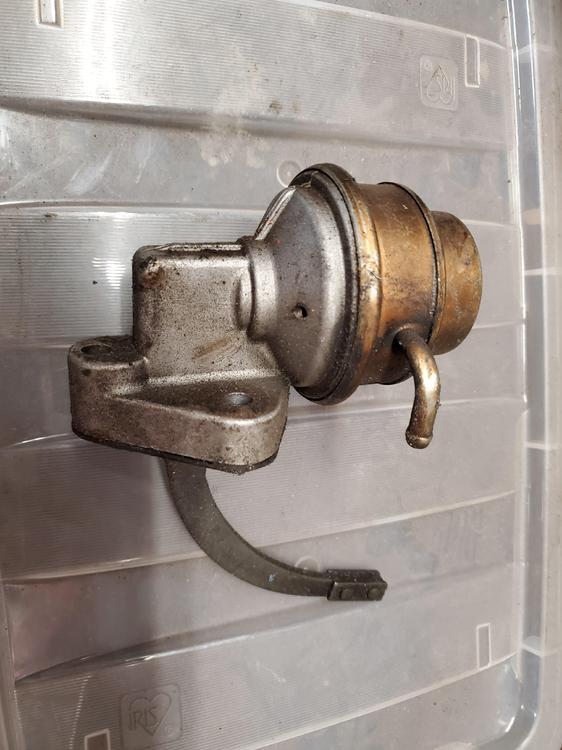
Cleaned and painted the front grill. Also, got a new fuel pump and installed that. Looks much nicer and closer to the original than the standard auto part fuel pump. I had an old original style pump that I removed the screws and fittings from and sent out with the last batch of plating parts. I will probably swap out the clear zinc fasteners and fitting for the yellow zinc parts once they come back from the plating shop just to get a bit closer to the original look.


-
It would be nice if they would at least take a 'guesstimate' of Total Covid-19 Cases. I would think they could at least have a chart with upper and lower limit estimates. This chart is a bit misleading. It is real exact data, just not the true complete picture.


.jpg.e5b272d00e8eb0a2cfd4e575c8ea13ee.jpg)