


LeonV
Free Member
-
Joined
-
Last visited
Everything posted by LeonV
-
 This guy is a troll, Jon. Leave him be in his own world...
 -
No, you don't need it, but as alluded to it will increase steady-state oversteer by changing your roll stiffness distribution. FYI, the US-spec 240Zs didn't come with a rear bar. It all depends on what you use the car for.
-
Also, the '79 280ZX was lighter than the '78 280Z. You can't say that about many sports car reiterations. So by that logic, the 280Z was even more of a bloated insult to sports cars.
-
Fantastic find! The drive to there must have been equally great, especially if you did it in the Z!
-
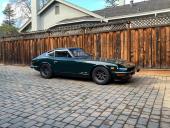
Beautiful, and I love the color!
-
That's funny, I had the opposite experience! I used PB for a while until I read that Liquid Wrench is better in an article. They backed it up with some testing as well. I finally got my spindle pins out after using Liquid Wrench. I'd been going at it with PB for a looooong time! I don't know whether it was coincidence or not, but Liquid Wrench has been working very well for me. I switched to LW because it's what my local store had. Looks like ATF/acetone home-brew is the best bet, out of the tested choices.
-
Gotta love the six. I'd go with an L28 if it's available to you. I was going to do a rebuild of my L24 until a free L28 came along. Take what you can get, either choice is plenty of fun. If the L28 is in good condition I'd use at least that block and put some SUs or triples on top.
-
-
-
Ah, that's right Gary. It's definitely been a while!
-
I haven't done this in a while, so correct me if I'm wrong. I thought that you start with the front carb and then use the balance screw to set the rear at idle and then at about 2500 rpm. Start the procedure at the front, maybe that will help. Leon
-
As I said earlier, I assumed what you were referring to the syncrometer as the one often advertised for Webers. Link for reference. It accomplishes the same thing, it's semantics at this point.
-
OP, As far as I know, the 4X4 calipers are used on front "upgrades" only. Those are some pretty big calipers to put in the back if that's the plan. I think that you can just fix the rear drums more easily and price effectively than changing to a completely different system. The stock brakes are more than good enough for the task, plus they keep the unsprung weight down compared to the "upgraded" brakes. If you're looking for performance, put in some Porterfield pads and shoes and you're good to go! It will be so much simpler and I doubt you'd regret the performance of properly maintained Z brakes with some good friction material.
-
Sure, but you don't need to say "unisyn rather than a syncrometer" because you are inferring that you can't use a Weber style syncrometer on the Hitachi carbs. I actually prefer the syncrometer because it lets you take readings without completely disrupting airflow to the carb. It's definitely more user friendly.
-
That doesn't make any sense to me. A synchrometer (assuming you mean the one usually advertised for Webers) works great with these carbs. The tool used doesn't really make a difference, it's all about doing the syncing procedure correctly.
-
The car looks gorgeous! Great work. Just FYI, a strut tower bar will do pretty much nothing to the handling of the car, especially if it's just a two-point bar. If you have a stock ARB and want to lessen roll, get a bigger ARB. Getting stiffer springs would also help, but be a larger sacrifice of ride quality. The strut bar will act as a very good drain for your wallet, however!
-
Take a look at zparts.com. Eric has a pretty big collection, as far as I know.
-
That only works when talking about hp and lb-ft and when the vertical scales on the plot are equal. That is an amazing looking engine bay! Still no video?
-
Does this not answer your question, Mike?
-
Everything you ask is in this thread, if you look.
-
Actually it's sado, and that's pretty damn funny! http://en.wikipedia.org/wiki/Sadomasochism
-
I agree about the pricing as well, $1500 is ridiculous! Might as well go standalone FI at that point. I think that $500 to $800 is more like it for a complete triple setup, depending on condition of course. I was actually planning to go dyno testing with well sorted SUs vs. Weber 40mm triples when my Z is back on the road. I have both setups and am curious as to the quantitative difference between them.
-
Are you trying to imply that SUs are able to optimally feed each cylinder? The manifold design for SUs has been proven to be flawed in terms of mixture distribution to each cylinder with WB02 data-logging. The AFR between cylinders is not consistent, and there are some nice bends in there as well adding more pumping losses. On the other hand, a triple setup gives each cylinder its own venturi. Bends in the intake tract are minimized and the mixture cylinder-to-cylinder is more or less consistent. It is also possible to do effective intake resonance tuning with this setup by simply switching out bell-mouths. Yes, SUs work well and are great for someone looking for street driving and decent performance. However, when it comes down to tuning and maximization of power (or efficiency), the Webers have a profound advantage. Yetterben brought up a good point in that the EP racers need to keep the stock carbs. You think that if carb choice were unlimited that SUs would be preferred over Webers? I think not. As for the OP, if you don't know a lot about cars don't even think about triples, unless your wallet feels too heavy.
-
SUs are great, but everything comes with its pros and cons. The SUs are easy to play with as long as the throttle shafts don't leak, but they leave some performance and tunability on the table. The Webers are more expensive, but you can tune them in much more detail. This assumes that one understands both systems well. I got a decent set of Weber triples for $600 complete including manifold and linkage. The deals are out there if you explore classifieds enough. I've seen quite a few recently in that price range, in varying condition. Also, don't slap parts on without thinking. You need to think about what you need in terms of what the car will be used for.
-
Aha! There it is...